To open long positions on EURUSD you need:
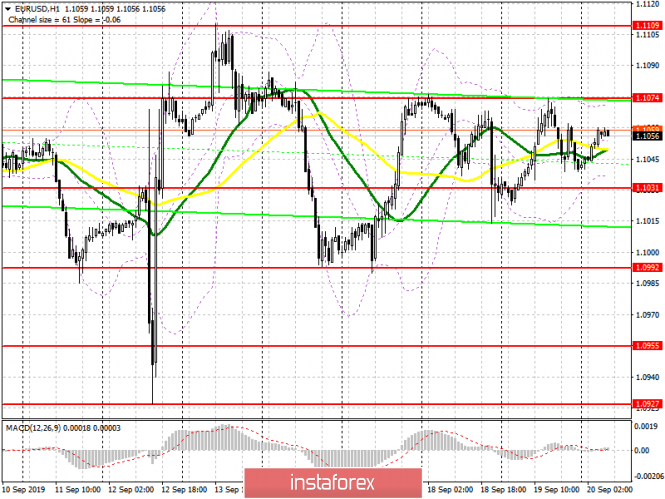
Yesterday it became known that the Federal Reserve Bank of New York conducted another buyback of debts in the amount of $ 75 billion, thereby providing banks with liquidity support. This time, sellers of the US dollar left this fact unattended, while on Tuesday this news led to a fall in the US dollar. Nothing has changed at all from a technical point of view. Buyers still need to break above the resistance of 1.1074, which will lead to the euro's continued growth to the area of a high of 1.1110, as well as to update a larger resistance level at 1.1151, where I recommend taking profits. If the pressure on the euro returns in the morning, then it is best to consider new purchases after updating support at 1.1031, with the condition of the next formation of a false breakdown there, or a rebound from a larger low in the region of 1.0992.
To open short positions on EURUSD you need:
Traders ignored the data on the state of the US economy yesterday in the afternoon, as well as a report on the negative growth of the current account balance of the US balance of payments, which maintained equilibrium in the market. Sellers will continue to wait for a breakout of support at 1.1031, which will increase the pressure on the pair and will lead to a further decrease to the area of a larger low 1.0992 and 1.0955, where I recommend taking profits. In case the pair grows in the first half of the day to the resistance area of 1.1074, one can look at short positions only on a false breakdown. You can sell EUR/USD immediately for a rebound from last week's high in the region of 1.1110. Given that important fundamental statistics are not expected today, volatility may remain quite low.
Signals of indicators:
Moving averages
Trade is conducted in the region of 30 and 50 moving averages, which indicates market uncertainty.
Bollinger bands
A break of the lower boundary of the indicator at 1.1040 will increase pressure on the euro, while the upper boundary at 1.1074 will limit the upward potential in the morning.

Description of indicators
- MA (moving average) 50 days - yellow
- MA (moving average) 30 days - green
- MACD: Fast EMA 12, Slow EMA 26, SMA 9
- Bollinger Bands 20
