To open long positions on GBP/USD, you need:
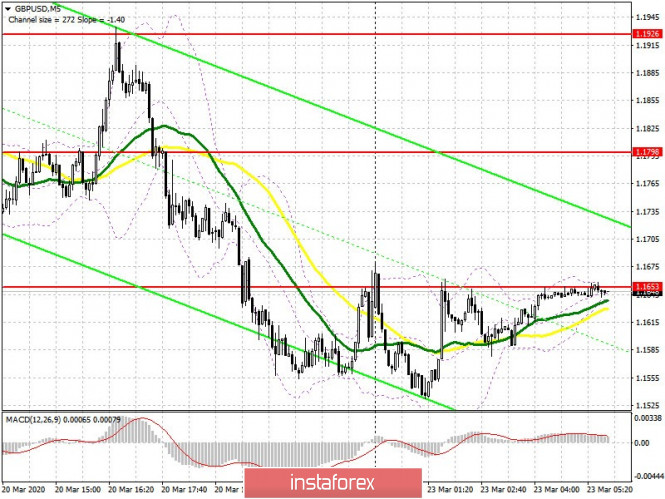
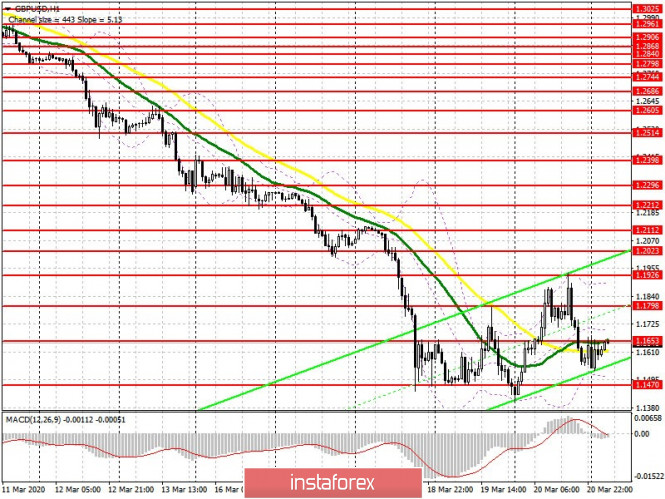
Several negative forecasts for a likely increase in the number of people infected with coronavirus in the UK and a sharp contraction of the economy this year returned pressure on the British pound on Friday, which seemed to have found the bottom and started its recovery. Now the bulls need to cling to the resistance of 1.1653, which will lead to a repeated upward correction to the area of 1.1798, where I recommend taking profits, as it will not be so easy to quickly break above this range. In case of an unsuccessful attachment to the resistance of 1.1653, long positions are best postponed until the formation of a false breakout near the support at 1.1470, or even better, postpone the purchase to test new yearly lows in the areas of 1.1470 and 1.1350. However, you can only count on a rebound of no more than 50-60 points of intraday correction from these levels.

To open short positions on GBP/USD, you need:
Sellers, although not immediately, showed themselves on Friday, arranging a large sale from the level of 1.1798, which is clearly visible on the 5-minute chart and which I paid attention to. Now the task of sellers is to hold the resistance of 1.1653, and the formation of a false breakout on it, in a place with weak fundamental data for the UK, will lead to another return of GBP/USD to the support area of 1.1470. However, only a break in this area will again resume a strong bearish trend for the pound in order to update the round figures 1.1400 and 1.1300, where I recommend taking profits. In the scenario of growth above 1.1653 in the first half of the day, the bears will count on sales from the resistance of 1.1798. If there is no volume after testing this area, it is best to postpone short positions until the high of 1.1926 is updated.

Signals of indicators:
Moving averages
Trading is carried out in the region of 30 and 50 moving average, which indicates the formation of the side channel, so it is best to open short positions on the pound after a correction from large resistances.
Bollinger bands
In the event of a decline, support will be provided by the lower boundary of the indicator at 1.1470. Growth will be limited by the upper boundary of the indicator in 1.1910.
Description of indicators
- Moving average (moving average determines the current trend by smoothing out volatility and noise). Period 50. The graph is marked in yellow.
- Moving average (moving average determines the current trend by smoothing out volatility and noise). Period 30. The graph is marked in green.
- MACD indicator (Moving Average Convergence / Divergence - moving average convergence / divergence) Fast EMA period 12. Slow EMA period 26. SMA period 9
- Bollinger Bands (Bollinger Bands). Period 20
