EUR/USD
Analysis:
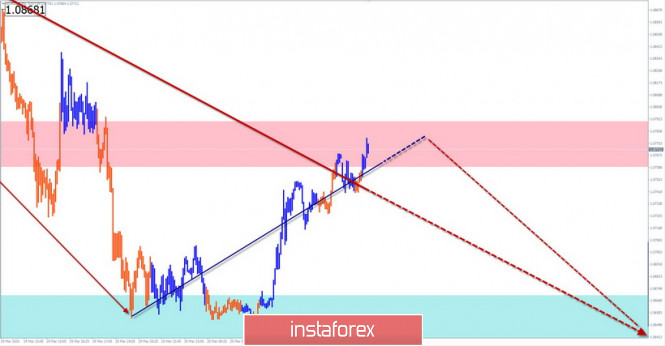
The price decline in the euro chart, which started on March 9, refers to a large-scale movement, no less than D1. The price has reached the potential reversal zone of the weekly timeframe. There are no reversal signals on the chart yet.
Forecast:
The price rise that started yesterday does not exceed the level of the pullback of the last section of the current wave. It is common to the flat attitude of the movement between the closest opposing zones. A downward trend is likely in the European session.
Potential reversal zones
Resistance:
- 1.0760/1.0790
Support:
- 1.0670/1.0640
Recommendations:
Given the pronounced impulse nature of the current decline, purchases of the European currency are irrelevant. Sales of the tool are recommended.

AUD/USD
Analysis:
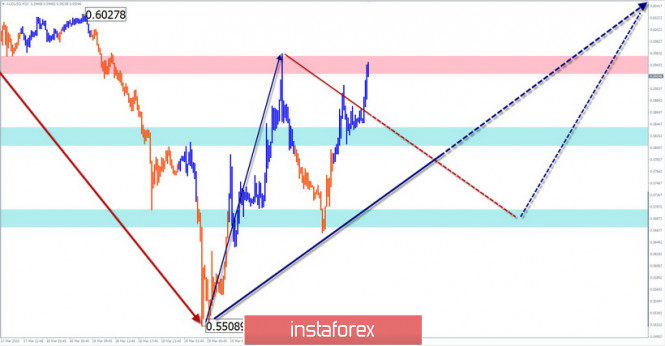
As a result of a downward spurt of 10 price figures over the past decade, the dominant bearish wave reached the upper limit of the preliminary completion zone. The price rise that started yesterday has a high wave level. If confirmed, it can become the beginning of a counter wave.
Forecast:
If the price correction that started yesterday does not go beyond the scale of the upward movement, conditions will be created for changing the inter-day trend. Today, a mostly downward mood is expected. The daily price move is likely to be no lower than the far support zone.
Potential reversal zones
Resistance:
- 0.5930/0.5960
Support:
- 0.5840/0.5810
- 0.5700/0.5670
Recommendations:
Without the appearance of unambiguous reversal signals, "Aussie" purchases are highly risky. When trading on the market of this pair, sell signals remain in priority.

Explanation: In the simplified wave analysis (UVA), waves consist of 3 parts (A-B-C). The last incomplete wave is analyzed. The solid background of the arrows shows the formed structure and the dotted one shows the expected movements.
Note: The wave algorithm does not take into account the duration of the tool movements in time!
The material has been provided by InstaForex Company - www.instaforex.com