To open long positions on EUR/USD, you need:
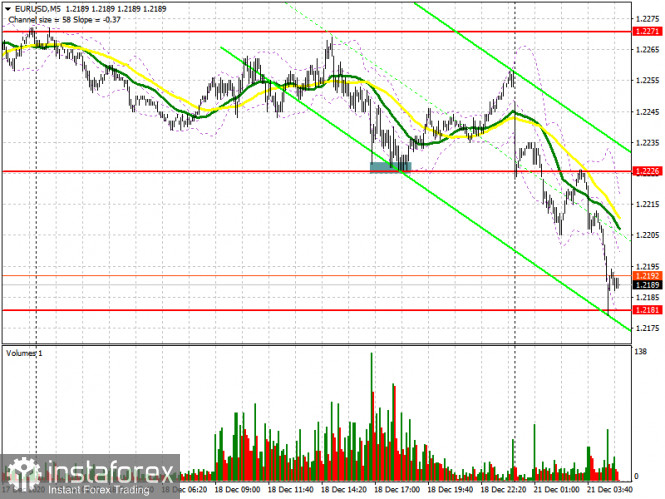
Last Friday was rather calm and the pair was trading in a horizontal channel. If in the first half of the day there were no signals to enter the market even amid good economic reports on the German economy, then during the US session, the bulls managed to defend support at 1.2226. Let's take a look at the 5-minute chart. It clearly shows how bears are testing support at 1.2226 several times, however, it has not been possible to go below this level, which leads to forming a signal to open long positions. Growth from 1.2226 was about 30 points.
But, before talking about the pair's further prospects, let's see what happened in the futures market and how the Commitment of Traders (COT) positions changed. Judging by the latest figures, several buyers of the euro decided to close part of their long positions at the end of the year. There are slightly more euro sellers than a week earlier, which indicates expectations of a downward correction closer to the Christmas holidays. The COT report for December 15 showed an increase in short positions and a reduction in long ones. Although buyers of risky assets believe that the bull market will proceed, especially amid expectations of vaccinations in the eurozone, which will begin from December 25 to 27, however, the rush to buy at current highs has obviously decreased. Thus, long non-commercial positions fell from 222,521 to 218,710, while short non-commercial positions increased from 66,092 to 76,877. The total non-commercial net position fell from 156,429 to 141,833 a week earlier. The growth of the delta, which was observed for three consecutive weeks, has stopped, so one can hardly count on the euro's rapid growth at the end of this year. There will be no further major recovery until European leaders negotiate a new trade agreement with Britain.

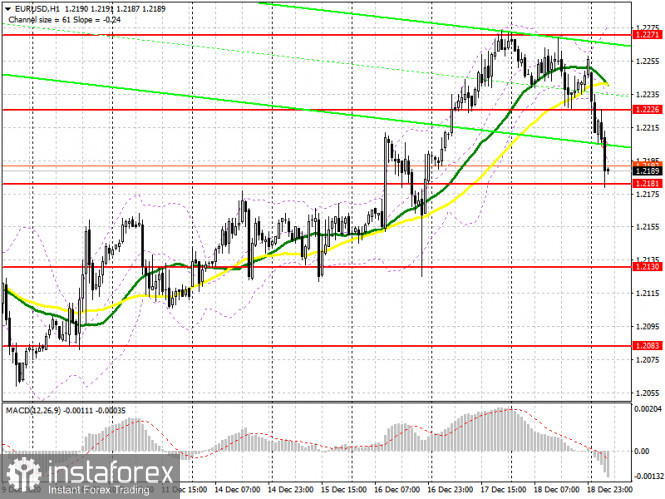
Now for the technical picture of the pair. Yesterday's news that the UK is quarantining due to a new type of coronavirus, which has gotten out of control and is spreading much faster than the previous one, has increased pressure on the euro today. At the moment, buyers need to regain control over resistance at 1.2226, as only this will lead to another upward wave for the euro and can sustain the bull market. A breakout and being able to settle above 1.2226 along with testing it from top to bottom produces a good signal to buy EUR/USD in hopes of renewing the next high in the 1.2271 area, where I recommend taking profits. The next target will be the high of 1.2206, which buyers will be aiming for this week. Since important fundamental statistics on the eurozone economy will not be released today, it will hardly be possible to expect that the price would surpass 1.22306. However, if this happens, I recommend raising long positions to the highs of 1.2339 and 1.2417. In case the euro falls in the first half of the day, buyers will have to try hard to protect support at 1.2181. It is best not to rush into long positions there, but to wait until a false breakout appears. I recommend buying EUR/USD immediately on a rebound from a low of 1.2130, counting on a correction by 20-25 points within the day.
To open short positions on EUR/USD, you need:
Sellers will actively defend resistance at 1.2226, slightly above which the moving averages pass, which is on their side. Forming a false breakout there can produce a new downward correction, and its purpose is to surpass the low of 1.2181, where it is possible to observe when the downtrend market could initially stop today. Being able to settle below this range will open a direct road to the 1.2130 area, where I recommend taking profits. Bad news about the new coronavirus strain will continue to weigh on the euro. The next target will be the 1.2083 area, testing it will mean a reversal of the current upward trend. If the bulls find strength and manage to surpass resistance at 1.2226, I recommend not to rush to sell. The optimal scenario would be a test of the 1.2271 high, where a false breakout will be a signal to sell the euro. I recommend opening short positions immediately on a rebound from the 1.2306 level, counting on the pair's correction down by 15-20 points.

Indicator signals:
Moving averages
Trading is carried out below 30 and 50 moving averages, which indicates a downward correction for the pair.
Note: The period and prices of moving averages are considered by the author on the H1 hourly chart and differs from the general definition of the classic daily moving averages on the daily D1 chart.
Bollinger Bands
If the euro grows in the afternoon, the average border of the indicator in the 1.2230 area will act as resistance.
Description of indicators
- Moving average (moving average, determines the current trend by smoothing out volatility and noise). Period 50. It is marked in yellow on the chart.
- Moving average (moving average, determines the current trend by smoothing out volatility and noise). Period 30. It is marked in green on the chart.
- MACD indicator (Moving Average Convergence/Divergence — convergence/divergence of moving averages) Quick EMA period 12. Slow EMA period to 26. SMA period 9
- Bollinger Bands (Bollinger Bands). Period 20
- Non-commercial speculative traders, such as individual traders, hedge funds, and large institutions that use the futures market for speculative purposes and meet certain requirements.
- Long non-commercial positions represent the total long open position of non-commercial traders.
- Short non-commercial positions represent the total short open position of non-commercial traders.
- Total non-commercial net position is the difference between short and long positions of non-commercial traders.
