AUD/USD
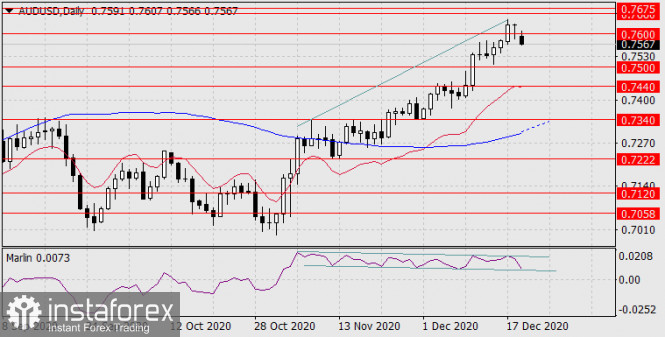
The extended divergence of the price and the Marlin oscillator on the daily chart, which is a sign that the asset would retreat, is reinforced by the oscillator's own signal line channel, which is a narrow range.

Since the signal line will leave this range, the oscillator will sharply fall as a result. Obviously, the fall of Marlin will carry over and lead to the asset falling as well, in this case, the Australian dollar. The oscillator may leave its own channel after falling by around 50 points, that is, the quote will be around 0.7550. In the future, the price may fall to the target level of 0.7340, which the MACD line approaches on the daily scale.

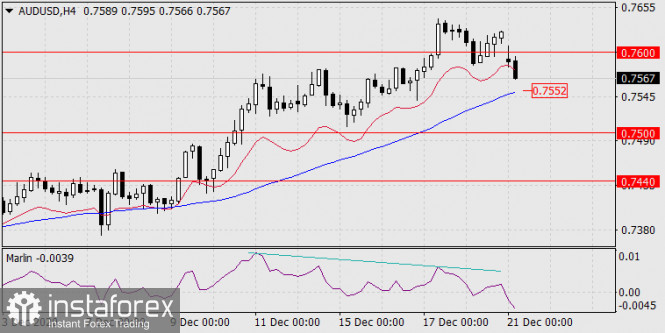
The four-hour chart shows that after the price divergence and the marlin oscillator formed, the signal line of the oscillator went into negative territory, showing the downward mood of the pair. As the price moves under the MACD line in the area of 0.7552, which coincides with the price value at the time when the Marlin signal line transitions from its own channel on the higher price chart, this level becomes more important.
So, when the price moves below the signal level of 0.7552, the following targets are open: 0.7500, 0.7440, 0.7340.
The material has been provided by InstaForex Company - www.instaforex.com