EUR/USD - 24H.
 EUR/USD - 24H.
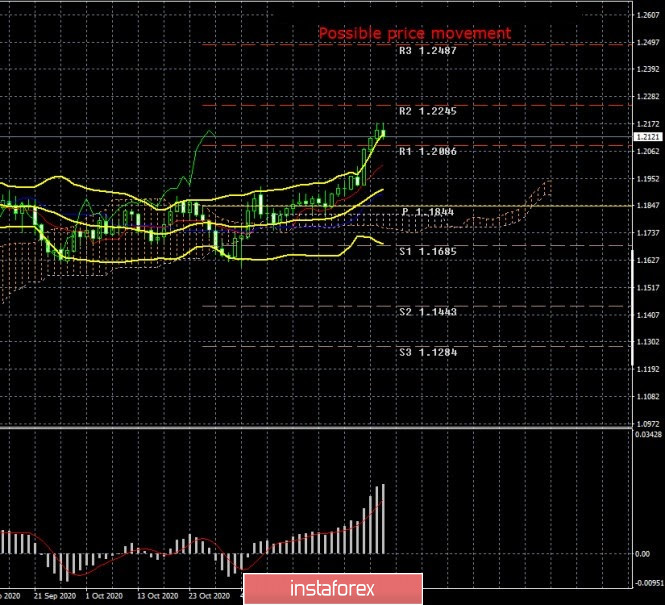
Over the past week, the EUR/USD pair has grown by more than 200 points. If a week earlier there was still hope for the bears, who for four months have not been able to start forming a new downward trend, then last week all these hopes collapsed. Quotes of the euro/dollar pair updated the previous high, and at the same time, two-year highs. Thus, we can now conclude that the upward trend has resumed. However, it is very difficult to say how long it will last. We have repeatedly drawn the attention of traders to a complex fundamental situation and a large number of factors that can affect the mood of traders and the movement of the pair. We still believe that from a fundamental point of view, there is no reason to strengthen the European currency. Macroeconomic statistics also do not speak in favor of the dollar and against the euro. Thus, the growth of the euro currency is purely speculative, or central banks and major players who conduct operations with the dollar and euro have entered the market without taking into account the "foundation" and other factors. Thus, as before, we recommend that any fundamental hypothesis be confirmed by "technique".
COT report.

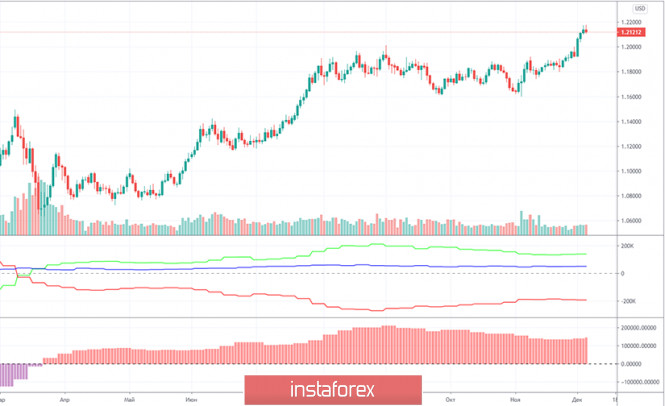
During the last reporting week (November 24-30), the EUR/USD pair increased by only 80 points. However, the new COT report for the second week in a row signals an increase in the "bullish" mood among professional traders. This time, the Non-commercial group opened 4.3 thousand new purchase contracts and closed 300 sales contracts. These numbers are not large. Even the general changes in favor of the bulls over the past two weeks can not be called "breaking the bearish trend". However, for two weeks in a row, the net position of non-commercial traders is growing. And it began to grow synchronously with the resumption of the upward movement of the euro/dollar pair. Unfortunately, COT reports are released three days late. Thus, they can be used to determine the trend, however, technical confirmation is always required for any conclusions made based on COT reports. What do we end up with? The number of open buy-contracts for professional traders remains high – 212 thousand, and the number of sell-contracts is three times lower than 67 thousand. The gap between them began to decrease around September (the second indicator showing the net position of the "Non-commercial" group), but at the moment it is increasing again. Thus, we still expect the end of the upward trend formation, because this is what all the data in the COT report (especially the first indicator) indicate. However, we need technical confirmation of this.
What can we say about the fundamental background of the past trading week? It didn't matter. Macroeconomic statistics were mostly ignored. Fundamental events were not taken into account. By and large, there are similar problems in the United States and the European Union, however, the American economy looks even a little more promising since it did not have a second "lockdown". This is very eloquently evidenced by data on business activity in the US and EU services sectors. There were fears that the unemployment rate in America will start to increase again due to the huge number of cases of "coronavirus", which is recorded daily. However, recent reports have shown that applications for unemployment benefits remain normal, secondary applications for benefits are decreasing in number, the official unemployment rate is decreasing, and inflation remains at quite normal values. Thus, we can even say that everything is fine in the US now if we take into account the global crisis and the pandemic. Of course, Jerome Powell regularly calls on the US Congress to agree on a new aid package for the economy. But it has not yet been agreed and it is unlikely that this is why the dollar is falling. After all, the European Union also has problems with assisting the economy. Poland and Hungary have blocked the EU's seven-year budget and recovery fund, and it may now take a long time to convince Warsaw and Budapest to withdraw their vetoes. And to do this, you will need to change the mechanism for observing the rule of law, which is not as easy as it may seem. In general, we do not believe that the European economy is now in a better state than the American one. Therefore, the reasons for the growth of the euro currency are not fundamental.
Trading plan for the week of December 7-11:
1) The pair's quotes have resumed the upward trend and now, in the next few weeks, they will aim for the levels of 1.2245 and 1.2487. Although the COT report and the fundamental background continue to signal a possible and very likely fall in the pair's quotes and the baselessness of the current growth, it can continue. "Technique" now eloquently signals an upward trend after a four-month flat.
2) To be able to sell the EUR/USD pair, you need to at least wait for the price to consolidate below the Kijun-sen and Senkou Span b lines. However, we do not expect such a development in the near future, since the price is very far from these lines. Thus, short positions can only be considered on lower timeframes if a downward trend is formed.
Explanation of the illustrations:
Price levels of support and resistance (resistance/support) – target levels when opening purchases or sales. You can place Take Profit levels near them.
Ichimoku indicators, Bollinger bands, MACD.
Support and resistance areas – areas that the price has repeatedly bounced from before.
Indicator 1 on the COT charts – shows the net position size of each category of traders.
Indicator 2 on the COT charts – the net position size for the "Non-commercial" group.
The material has been provided by InstaForex Company - www.instaforex.com