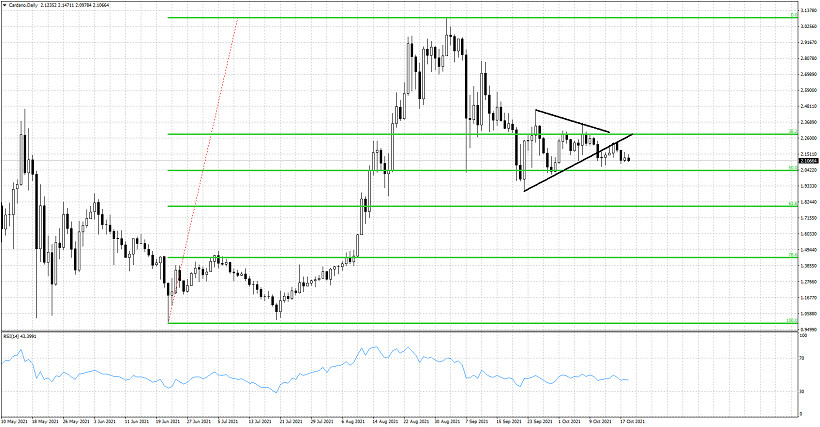
Cardano as we mentioned in previous posts, has provided us with a bearish signal after breaking out and below the triangle pattern it was. Price has back tested the triangle pattern from below, but price seems unable to gather momentum for a move higher.

Green lines - Fibonacci retracements
Cardano is now trading around $2.10 but price has continuously made higher lows over the past few days. Having broken out of the triangle pattern makes price vulnerable to a move lower. Support is at recent low of $2.06. Breaking below it will open the way for a move towards $1.82-$1.80. Resistance is at $2.29. Bulls need to break above this level in order to decrease the chances of any move lower.
The material has been provided by InstaForex Company - www.instaforex.com