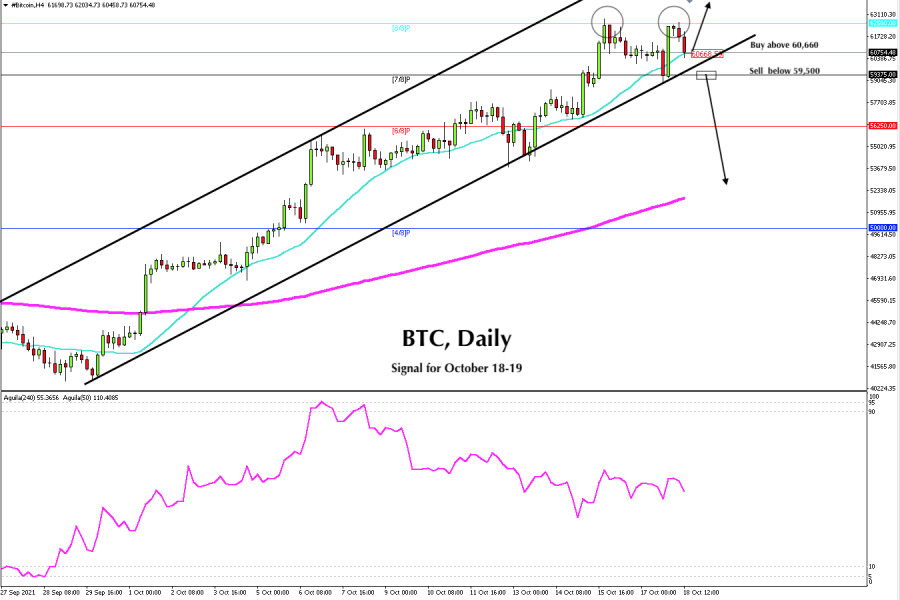
The price of Bitcoin (BTC) has reached the level of strong resistance at 8/8 Murray around 62,500. On Friday and today in the European session, it tested this resistance and has formed the Double Top pattern. If the break below 59,500 is confirmed in the short term, there could be a drop to the support of 6/8 Murray at 56,250 and to the 200 EMA located at 51,900.
To keep the uptrend intact, buyers should buy at the 21 SMA located at 60,600. If BTC bounces off the bottom of the bullish channel, it could gain momentum to break the 62,500 resistance and could rise to -1/8 of Murray located at 65,625.
Four months ago, on July 18, BTC upward cycle began, and since then it has gained more than 100% in profitability from the low of 29,700. It could be a sign that in the medium term, BTC could have a downward correction. The technical indicators are showing overbought signals, and it may happen that some buyers withdraw their gains, in case the price action starts to turn negative.
In case buyers are unable to sustain trading above the 21 SMA located at 60,600, a bearish correction can be expected. Only if BTC breaks below the bullish channel and consolidates below 7/8 of Murray about 59,500, a decline to the support at 56,250 and to the psychological level of 50,000 can be expected.
Our forecast is bullish as long as BTC is trading within the channel on 4-hour charts, a sharp break in this channel and a consolidation below 60,000 could be a signal to sell in the correction to 56,250.
Support and Resistance Levels for October 18 - 19, 2021
Resistance (3) 65,625
Resistance (2) 63,343
Resistance (1) 62,500
----------------------------
Support (1) 60,842
Support (2) 58,340
Support (3) 57,352
***********************************************************
A trading tip for BTC for October 18 - 19, 2021
Sell below 59,500, with take profit at 56,250 and 51,000 (EMA 200), stop loss above 60,500.
The material has been provided by InstaForex Company - www.instaforex.com