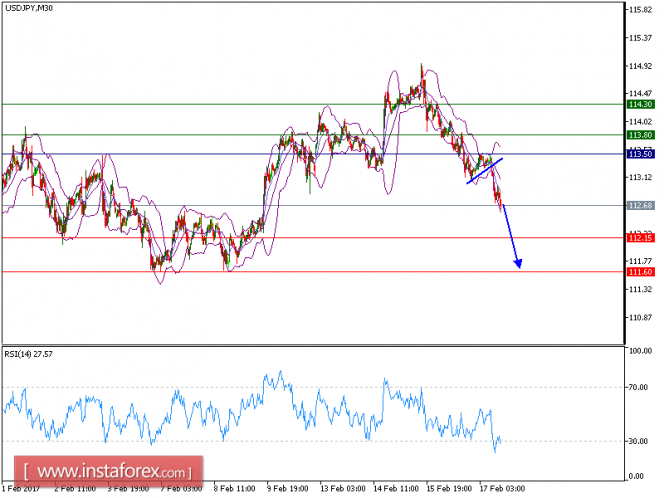
USD/JPY is under pressure. The pair is holding on the downside and is capped by a bearish trendline (since Feb. 15), which confirms a negative outlook. The downward momentum is further reinforced by its declining 50-period moving average. The relative strength index is below its neutrality level at 50. Even though a continuation of technical rebound cannot be ruled out, its extent should be limited.
US economic releases were broadly better than expected. The Philadelphia Federal Reserve Bank posted its business outlook index at 43.3 for February (vs. 18.0 expected, 23.6 in January), the highest reading since January 1984. The Labor Department reported that initial jobless claims amounted to 239,000 for the week ended February 11 (vs. 245,000 expected). In other reports, the Commerce Department said housing starts fell 2.6% on month in January (vs. +0.0% expected) and building permits rose 4.6% on month in January (vs. +0.2% expected) to an annual rate of 1.29 million units, the highest level since November 2015.
As long as 113.50 holds on the upside, look for a further drop to 112.15 and even 111.60 in extension.
The pair is trading below its pivot point. It is likely to trade in a lower range as long as it remains below the pivot point. Short positions are recommended with the first target at 112.15. A break below this target will move the pair further downwards to 111.60. The pivot point stands at 113.50. If the price moves in the opposite direction and bounces back from the support level, it will move above its pivot point. It is likely to move further to the upside. According to that scenario, long positions are recommended with the first target at 113.80 and the second one at 114.30.
Resistance levels: 113.80, 114.30, and 114.75
Support levels: 112.15, 111.60, and 111.25
The material has been provided by InstaForex Company - www.instaforex.com