Trading plan for 17/02/2017:
On Friday 17th of February there will not be many economic releases during the European and American trading sessions, so let's take a look at the overall market conditions to see whether there is a good trading setup among the major pairs that traders can use to make money.
GBP/USD analysis for 17/02/2017:
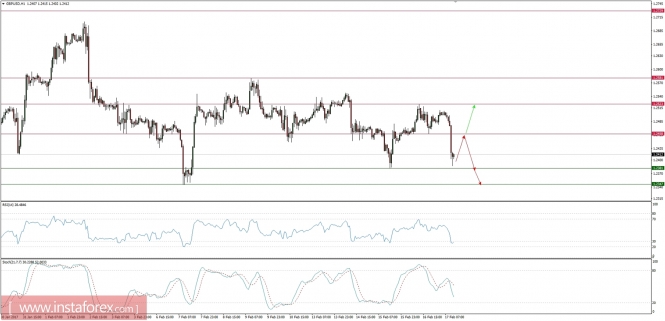
The Retail Sales data released this morning were way worse than expected. The market participants expected an increase in sales at the level of 1.0%, but the number released was at the level of -0.3%. This means the sales are not rising fast enough and this is not good for the British Pound.
At the hourly time frame chart, we can see an immediate sell-off after the news towards the level of 1.2381, but this intraday support has not been violated yet. Because the market conditions are starting to look oversold, the next intraday move should be the test of the recent resistance at the level of 1.2458 and then sell-off continuation. Violation of the level of 1.2381 will open the road towards the next support at the level of 1.2347.

USD/JPY analysis for 17/02/2017:
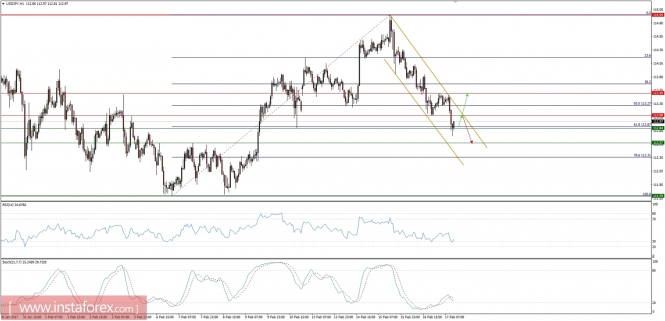
At the hourly time frame chart, the bears have managed to push the prices lower towards the 61%Fibo at the level of 112.87. The hammer candle indicates the fall might be terminated and oversold market conditions and growing bullish divergence supports this view. In a case of a rally, the next target for the bulls is at the level of 113.08 and 113.49.

USD/CHF analysis for 17/02/2017:
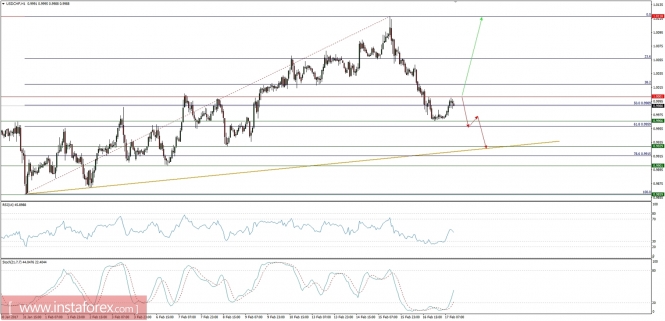
The most important candle at the daily time frame chart is a Doji candle with a top at the level of 1.0120. Since reaching this level, the market had been declining towards the 61% Fibo at the level of 0.9959 and missed this level by 10 pips so far. Nevertheless, the market conditions are oversold and now the price should correct higher towards the intraday resistance at the level of 1.0000. Any break out higher above this level might lead to the test of the next resistance at the level of 1.0118.

USD/CAD analysis for 17/02/2017:
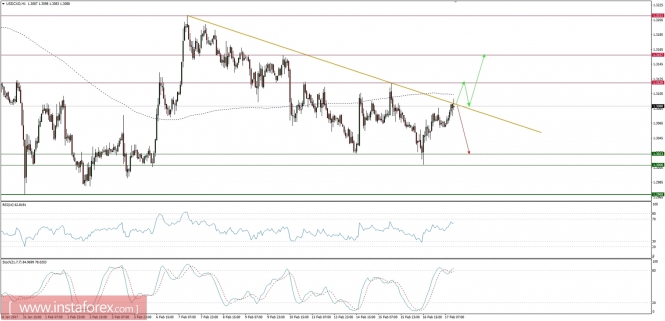
The golden trendline at the intraday chart is currently the most important dynamic resistance level. The bull camp is currently testing it from the downside and any sustained violation of this resistance will lead to the further gains. The next target for the bulls will be at the level of 1.3120, but in a case of a failure here, the price will fall back towards the next intraday support at the level of 1.3023.

