
USDX still finds dynamic resistance at the 200 SMA (H1 chart), in an effort to trigger a bearish catalyst that helps to strengthen further pullbacks toward the 100.00 handle. It seems that the index will look for a breakout above April 12nd highs and if that happens, then we can expect a rally to test the 100.97 zone.
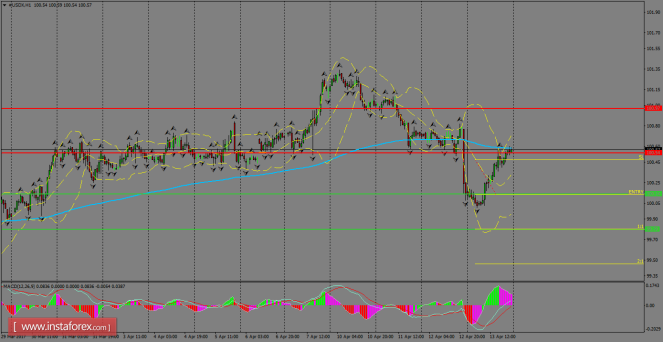
H1 chart's resistance levels: 100.54 / 100.97
H1 chart's support levels: 100.14 / 99.79
Trading recommendations for today: Based on the H1 chart, place sell (short) orders only if the USD Index breaks with a bearish candlestick; the support level is at 100.14, take profit is at 99.79 and stop loss is at 100.47.
The material has been provided by InstaForex Company - www.instaforex.com