Technical outlook:
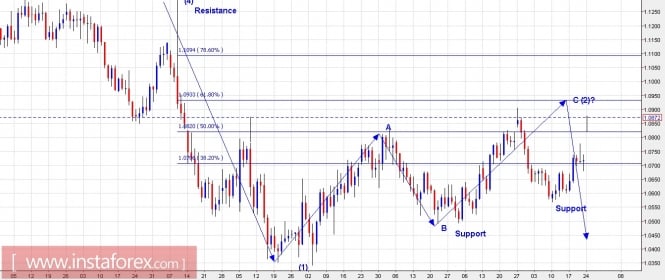
The EUR/USD pair gaped up today during early hours of trade towards 1.0935 levels but reversed lower after that. Please note that the pair has hit the Fibonacci 0.618 resistance of the entire drop from 1.13 to 1.0350. The bigger picture has been presented here on the daily chart. The entire rally started in January 2017 still looks corrective and hence a bearish reversal can be still expected around these levels. The waves (1) and (2) seem to be completed now and the overall bearish trend should resume.The resistance at 1.1300 is in place now for bears to remain in control.
Trading plan:
Please remain short and look to increase trading volume with the stop at 1.0950/60 and targets lower towards 1.03 and 1.0000. The trend should take several weeks to unfold.
GBP/USD chart setups:

Technical outlook:
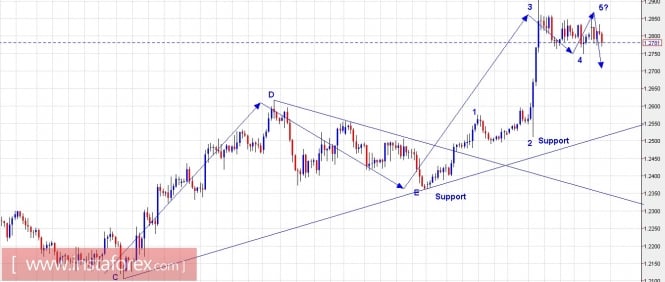
The GBP/USD pair is still moving sideways after breaking out of the triangle consolidation earlier. Please note that the pair had broken the last triangle after printing wave E at 1.2363 (labelled on 4H chart). Looking at the wave counts, the pair might be still looking to push higher one last time before reversing lower again. Please note that the bearish trend should resume any moment but we would like to see a top and reversal forming before selling again. Price support is seen at 1.2500 levels, followed by 1.2360, and a break there would be an extremely encouraging sign to bears. Importantly, the immediate trend line support is also coming around 1.2500 levels.
Trading plan:
Please remain flat for now and look to sell around 1.2950-1.3000 levels, stop placed at 1.3050 and the target is lower towards 1.2000. The short setup should be materializing in a day or two.
Fundamental outlook:
No major fundamental events lined up on the calendar for today. Unless some geopolitical news appears, the markets should remain quiet.
Good luck!
The material has been provided by InstaForex Company - www.instaforex.com