Technical outlook:
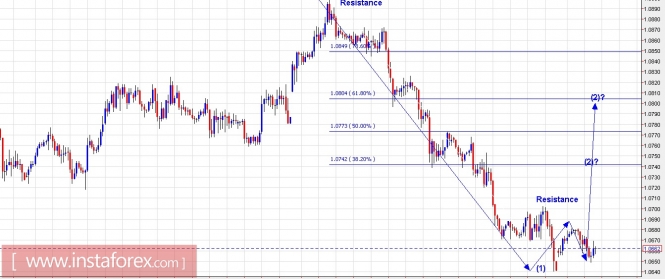
It looks like the EUR/USD pair finally terminated wave (1) at 1.0640 level last Friday, as labelled here. Continuing further, from our review last week, the pair should be producing its counter trend rally any moment and terminate wave (2), as seen above. Please note that the second wave can extend through 1.0800/05 levels ideally, since it is also Fibonacci 0.618 resistance of the entire drop between 1.0906 and 1.0640 levels respectively. Also, please watch out for resistance round 1.0770 level which is previous wave 4 of a lesser degree (not labelled here). If the above wave count holds true, the prices should ideally stay below 1.0906 level and look to print lower lows and lower highs, after terminating into wave (2). Immediate support is seen at 1.0640 level, while resistance is at 1.0906 respectively.
Trading plan:
Aggressive strategy would be to go long now with a stop below 1.0640 targeting 1.0740/50 at least. While conservative strategy would be to remain flat for now, sell on rallies through 1.0750/1.0800 levels, stop is at 1.0950 and target is 1.0350 and lower.
Gold chart setups:

Technical outlook:
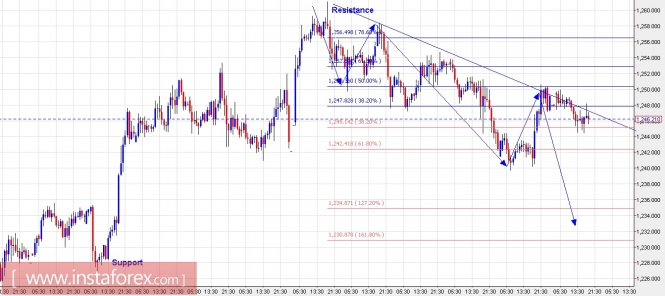
Gold had hit below the first projection at $1,240 level before pulling back again. Please note that the metal had broken below initial price support as well. The subsequent rally towards $1,250 level looks to be 3 waves (corrective) till now since the prices slid below $1,245 level again. Also note that the trend line resistance has also been tested and the metal remains into the sell zone for now. Furthermore, the extensions are also pointing towards a potential drop towards $1,235 levels if not lower. Finally, the prices have also tested its Fibonacci 50% resistance, as seen here. If the above structure holds, Gold has got potential to push lower at least towards $1,230/35 levels from here. It is still too early to project with confirmation that Gold could dip towards $1,180 level or not but $1,220 seems to be possible. Immediate support is at $1,228 level, while resistance is seen at $1,255.00 level respectively.
Trading plan:
Please continue holding short positions now, stop is at $1,261, targeting at least $1,230.
Fundamental outlook:
Please watch out for USD ISM manufacturing data coming out in less than 10 minutes at 10:00 AM EST. It could be setting up for the counter trends discussed above.
Good luck!
The material has been provided by InstaForex Company - www.instaforex.comfrom www.instaforex.com https://www.instaforex.com/forex_analysis/90067/?x=BPDZ
via IFTTT
