Global macro overview for 30/05/2017:
Solid data were released from the Australian house market. According to the Australian Bureau of Statistics new house approvals climbed 4.4% to 17,414 on a seasonally adjusted basis in April, following the preceding month's upwardly revised fall of 10.3% and surpassing expectations for a 3.2% increase. On the other hand, on a yearly basis the number of domestic building permits was down 17.2%, but it was still better than market expectations of a 18.1% decrease and last month figure of 19.9%. Private sector houses represented more than half of the total, which translated into a month-on-month increase of 0.5%.
Strong growth in new approvals and permits indicates a growing housing market and a strong housing market also tends to lead consumer spending. Because real estate generally leads economic developments - housing tends to thrive at the start of booms and wane at the onset of a recession. Currently, the prices of real estate in Australia remain at highly elevated levels and many house market analysts think they are already in a bubble. The Australian two most expensive housing markets are located in Sydney ale Melbourne. Despite the fact that this month the prices were down 1.3% in Sydney and 1.8% in Melbourne, the overall gains for the last twelve months have increased in double-digit percentage gains.
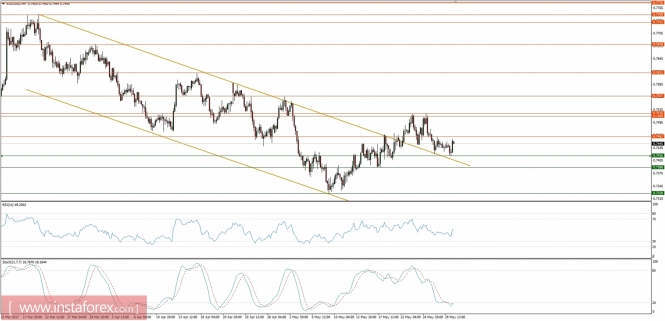
Let's now take a look at the AUD/USD technical picture on the H4 time frame. The market has broken out of the golden descending channel and now the price is testing the golden trend line from the downside. The next support is seen at the level of 0.7416 and the next resistance is seen at the level of 0.7461.

