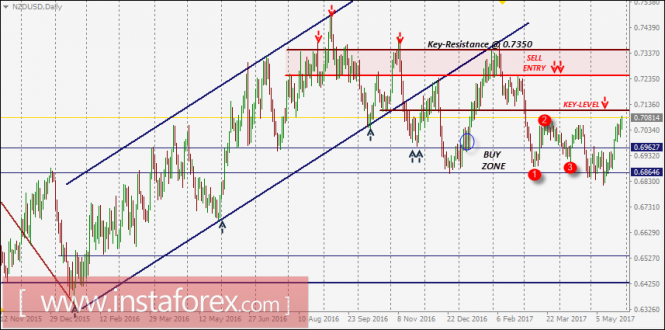
In December 2016, a bullish breakout above 0.6960-0.7000 allowed the pair to head toward the price level of 0.7100 (the key level) which failed to provide sufficient bearish pressure on the pair.
Bullish persistence above 0.7100 allowed a further advance towards 0.7250-0.7350 (sell zone) where the bearish price action was expected.
Bearish persistence below 0.7250 allowed a further decline towards 0.7100 then 0.6960 that failed to provide enough support for the pair.
That is why, a further fall was expected toward 0.6860 (the lower limit of the depicted BUY zone) where a bullish position was suggested in previous articles.
Recently, a bullish breakout was achieved above the depicted key level (0.6960). However, the pair failed to keep enough bullish momentum above 0.7050.
That is why, the NZD/USD pair became trapped within the depicted consolidation range (0.6860-0.6960) once again.
Note the depicted bullish 1-2-3 pattern remains valid as long as bullish fixation above 0.6900-0.6850 is maintained on a daily basis.
As anticipated, the current bullish breakout above 0.6960 enhanced further bullish movement towards 0.7100.
An expected, the projection target for the pattern is located around 0.7250 provided that bullish breakout above 0.7100 (key level) is achieved on a daily basis.
The material has been provided by InstaForex Company - www.instaforex.com