Trading plan for 03/05/2017:
On May 3, the event calendar is heavy with economic releases. At first, market participants will get the UK Construction PMI data, then Flash GDP estimates from the Eurozone and after that the Unites States will post the ADP Non-Farm Employment Change data and the ISM Non-Manufacturing reading. Moreover, the Federal Reserve will announce its rate decision and publish the post-meeting statement today.
Analysis of GBP/USD for 03/05/2017:
The UK Construction PMI data is scheduled for release at 08:30 am GMT, and market participants expect almost unchanged reading at the level of 52.2 points. Construction figures are an important indicator of housing demand. The reading above fifty indicates expansion and any number below fifty is a sign of contraction.
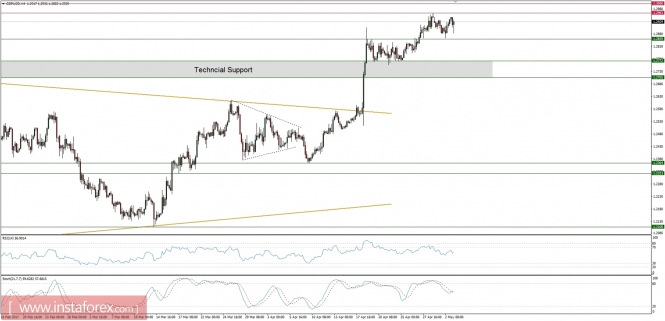
Let's now take a look at the GBP/USD technical picture on the H4 timeframe. If the PMI data is better than expected, then bulls may attempt to rally towards the level of 1.3000, because this level still works like a magnet for the price. The key intraday support lies at 1.2859. Breaking this level in case of worse than expected data will push the price towards the next support at the level of 1.2772.

Analysis EUR/USD for 03/05/2017:
The Flash GDP data from the eurozone is scheduled for release at 09:00 am GMT. Market participants expect a slight improvement from 0.4% to 0.5% for this month, possibly because they remember Mario Draghi's latest comments regarding the EU economy. He said, that the eurozone's economic trend is "increasingly solid". Nevertheless, even if the pace of growth holds at 0.5%, the news should be taken with a pinch of salt since it will confirm that the economy continues to recover, but it might soon get elusive just like a couple of years earlier.
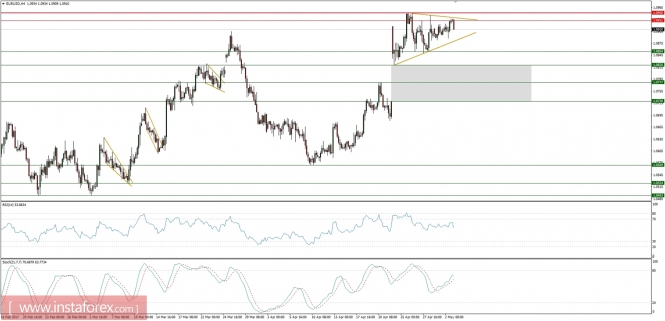
Let's now take a look at the EUR/USD technical picture on the H4 timeframe. The triangle technical pattern is seen around the top of the trading range at the level of 1.0950, so the market may breakout from the triangle any time now. The weekend gap is still not filled (marked as a gray rectangle), so if the break below occurs, then the gap is very likely to be filled.

Market snapshot: Oil extended losses after inventory data
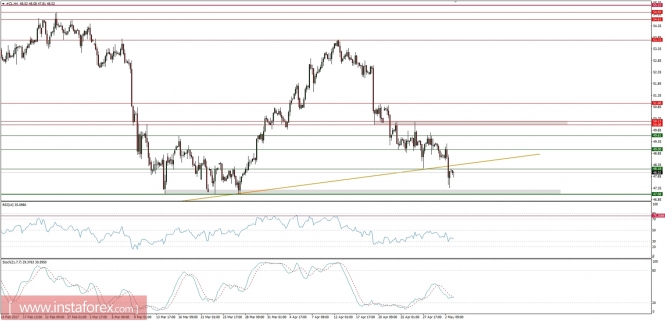
Crude oil prices broke below the golden trend line support at the level of 48.18 and now are trading close to the important technical support at the level of 47.08. The most importnat intraday resistance is found at the level of 48.18 and only a sustiained break above this level may signal a recovery with a projected target at 50.08.

