Global macro overview for 08/06/2017:
The Crude Oil Inventories data have surprised market participants which resulted in a strong drop in the price of black gold. Crude Oil Inventories showed a rise of 3.3 million barrels against expected 3.5 million barrel drawdown. With such a huge miss, the effect was predictable with Brent plunging -3.60% and WTI collapsing by -4.30% to end the New York session. In this season of the year, the market should experience a seasonal fall in fuel stocks as expected, but these are rising instead. Moreover, since the OPEC production cut agreement in May, oil has now fallen nearly 12%. Cutbacks were maintained at the current level of 1.8 million barrels a day, but in order to limit and control the price drop, the OPEC might start to introduce another measure in form of an increase of the daily production cut. The agreement will not cover Libya and Nigeria, which will not have to limit extraction, and possibly Iran, which may even increase its crude production to 3.8 million barrels per day. In conclusion, if the OPEC would decide to introduce further production cuts, then the prices of oil might fall even deeper and visit the levels of $40 per barrel not seen since July last year.
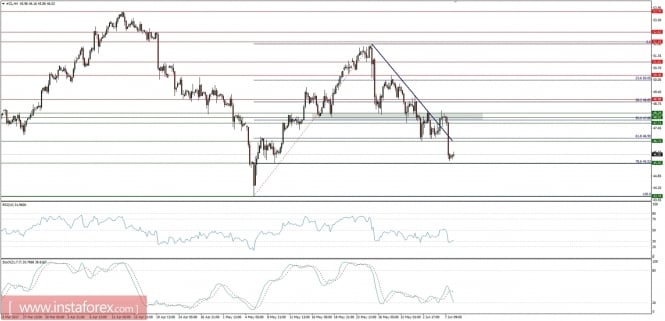
Let's now take a look at the Crude Oil technical picture on the H4 time frame. After a short-lived rally above the navy trend line towards the technical resistance at the level of $48.24, the price reversed after the data and now is trading back under the trend line around the Fibonacci 78% retracement at the level of $45.52. In a case of a further sell-off, the next support is seen at the level of $43.74.

