Technical outlook:
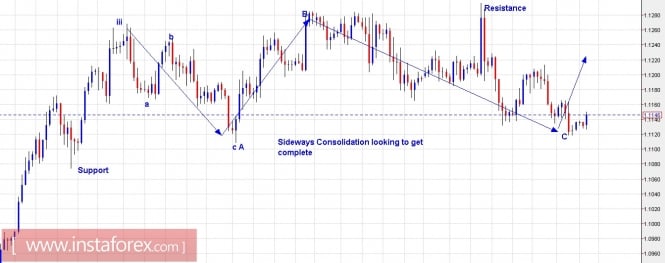
Last session, we had been discussing a potential bottom formation in EUR/USD and taking profits off the short positions earlier. The pair is seen to be rallying towards higher levels either from here or from slightly lower levels at 1.1000. Looking into the wave structure, EUR/USD might have completed its sideways consolidation (flat) structure near 1.1110 levels yesterday. If this wave count holds true, then we should be seeing higher levels above 1.1300 levels before the pair turns lower again. On the flip side, an extended drop below 1.1100 levels could find support at 1.1000 levels to terminate a standard flat wave structure and resume rally.
Trading plan:
Please consider long positions from here, stop below 1.1109, target above 1.1300
GBP/USD chart setups:

Technical outlook:
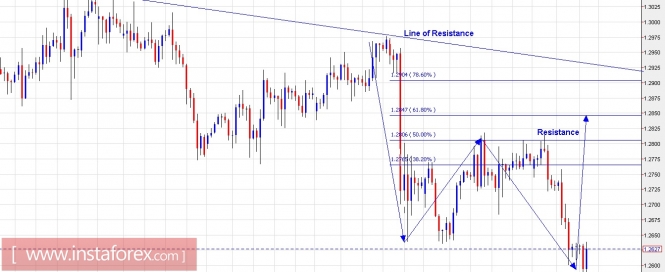
The GBP/USD pair has finally made interim lows or bottom at 1.2589 levels today. The pair has managed to pull off a sharp recovery through 1.2630 levels after that, taking out initial resistance at 1.2630 levels as seen on lower timeframes. The 4-hour indicators are also telling a story that a recovery should be underway and it may exceed 1.2830 levels going forward. Furthermore, it has also produced a huge engulfing bullish candlestick pattern as well, indicating that bulls are coming back in control for now. Besides, the indicators are showing a bullish divergence (not shown here), indicating a potential recovery to a meaningful fibonacci resistance level as shown above.
Trading plan:
Please remain long now, stop at 1.2580, targeting 1.2830/40.
Fundamental outlook:
Even today the event book shall remain void of major news for the rest of the trading day.
Good luck!
The material has been provided by InstaForex Company - www.instaforex.com