Trading plan for 05/07/2017:
The market is slowly going back to its normal routine after the US holiday. EUR/USD is trading at 1.1350, around the figure below the key resistance. USD/JPY is between 112.80 and Monday's high of 113.45. GBP/USD is at 1.2920. None of the three major currency pairs has changed their prices by more than 0.1%. The only pair that is marginally higher than yesterday is AUD/USD.
On Wednesday 5th of July, the event calendar is dominated again with Composite and Services PMI releases from all over the Eurozone and the UK. Later during the US session, market participants will be absorbing Factory Orders data and FOMC Meeting Minutes from the last month.
EUR/USD analysis for 05/07/2017:
The Services and Composite PMIs are scheduled for release during the early hours of the London session, from 07:15 am GMT to 08:00 am GMT. The PMIs will be released from the major Eurozone economies like Germany, France, Italy, Spain, and the Eurozone itself. Generally speaking, the PMIs from Germany and France are expected to increase and PMIs from Spain and Italy are expected to decrease in the reported month. Earlier this week, the financial markets were flooded with the PMI Manufacturing data from the Eurozone and this data was better than expected as the Eurozone economy, especially Germany and France are growing up at a steady pace. If today's data meets the expectations again, the Euro might receive a boost across the board again.
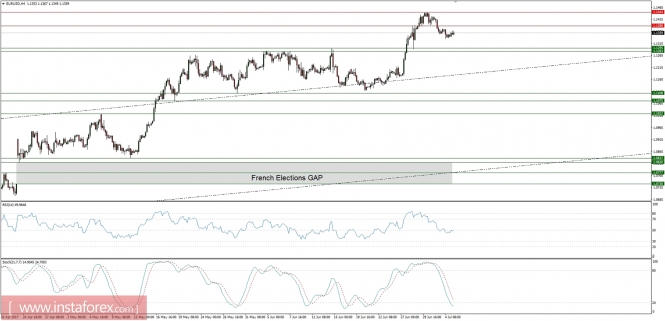
Let's now take a look at the EUR/USD technical picture on the H4 time frame. The pair is trading quietly in a tight range between the levels of 1.1295 - 1.1368 as market participants are waiting for the volatility to kick in. The market conditions are starting to be oversold and the momentum indicator is bouncing from the fifty level. This situation supports the view, that is a case of better than expected data EUR/USD might try to bounce higher towards the technical resistance at the level of 1.1444.

Market Snapshot: EUR/JPY making Triple Top pattern?
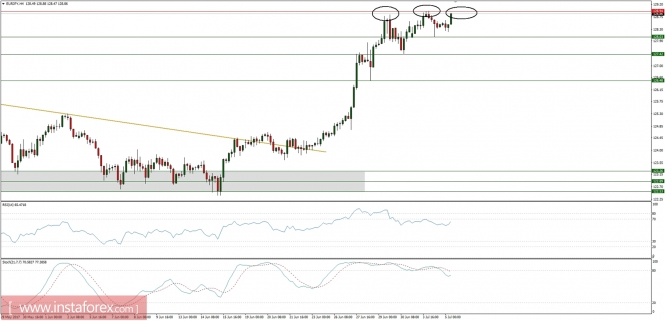
The price of EUR/JPY is moving towards the level of 128.54 for the third time, which means the Triple Top pattern might be in progress. The visible bearish divergence between the price and momentum indicator supports this view. Moreover, the stochastic oscillator is getting away from the overbought zone as well. The next technical support is seen at the level of 128.03 and 127.42.

Market Snapshot: Gold moves below the trend line
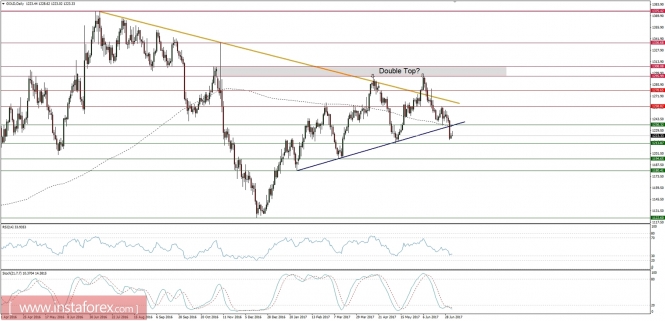
The price of Gold has broken below the important daily trend line with a daily candle close below it. Currently, the market conditions are oversold, so a bounce towards the technical resistance at the level of 1,238 is expected and then the sell-off should continue. The next important technical supports are at the levels of 1,214, 1,194, and 1,180.

