Trading plan for 28/07/2017:
On Friday 28th of July, the event calendar is busy with important economic releases. At the beginning of the London session, France will present the Preliminary GDP, Consumer Spending, and Consumer Price Index data. After that Spain will post its GDP and Consumer Price Index data as well. Switzerland will post the KOF Economic Barometer data and Germany will unveil the Preliminary CPI. However, the key event of the day is Gross Domestic Product data release from Canada and Preliminary GDP data from the US.
EUR/USD analysis for 28/07/2017:
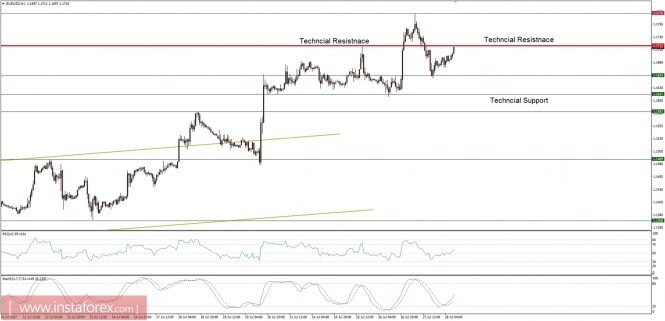
There is plenty of data that might influence the rate of EUR/USD today. During the London session it will be the CPI and GDP data from France, Spain, and Germany and during the US session, it definitely will be the Preliminary GDP data from the US. The median forecast for the US GDP growth during the second quarter is 2.5% (the seasonally adjusted annualized rate). The growth in the first quarter was very weak at only 1.4%, but in recent years this is quite common and weakness during the first quarter is widely believed to be transitory. The average trend growth of the past couple of years has been just a little bit above 2%. So, to continue the increase in the second half of 2017 (and for the FED to continue hiking rates), the consumer fundamentals need to improve further. Business surveys (such as the ISM series) suggest a strong rebound while healthy retail sales, firm jobs growth and durable goods orders also support this view.
Let's now take a look at the EUR/USD technical picture at the H4 timeframe. If the data beats the expectations, then there is a good chance for a further deterioration in price, possibly below the technical support at the level of 1.1654. Currently, the price is trading just below the important old technical resistance at the level of 1.1714, so any failure to break out higher would support the possible pullback towards the mentioned level. On the other hand, the up trend is still strong and in a case of a miss, the new highs are expected.

Market Snapshot: Nasdaq to start a correction?
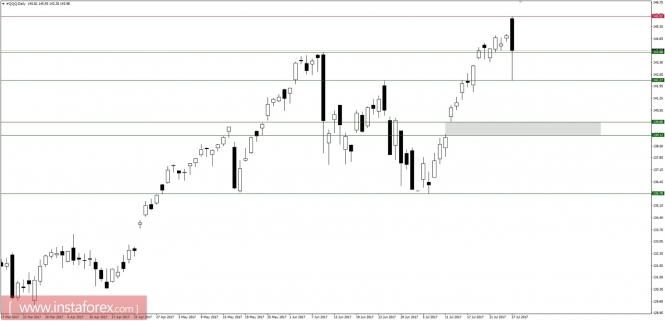
After disappointing results, the QQQ index (Nasdaq ETF) has filled the gap up and was going down until it bounced from the technical support at the level of 142.27. The interesting daily candle might suggest the index has started a corrective cycle that might accelerate if more of the US stocks will post more disappointing financial results. The next technical support is seen at the level of 135.78, but there is still unfilled gap above, between the levels of 139.12 - 139.88.

Market Snapshot: USD/CHF test the trend line
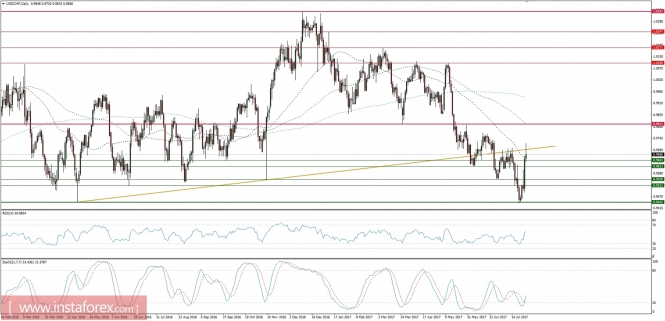
The price of USD/CHF has tested the old trend line from below at the daily timeframe and the bull camp has managed to make a marginal new high at the level of 0.9720. This might be the beginning of more substantial rebound in this pair as the market conditions are severely oversold.

