Trading plan for 15/08/2017:
On Tuesday 15th of August, the economic calendar is busy with the important news releases. Market participants will pay attention to the German GDP data, the Producer and Import Prices data from Switzerland and CPI data from the UK. During the US session the Retail Sales data, the Empire State Manufacturing Index data, the Import Price Index and the Business Inventories data from the US will be released.
EUR/USD analysis for 15/08/2017:
The German GDP data for the second quarter were released at the level of 0.6% which was worse than the market consensus of 0.7% and worse than a 0.7% advance from a month ago. The German statistics office said that positive impulses in the second quarter came from domestic demand, state spending and private consumption. Investment in construction and equipment also supported overall GDP growth, but foreign trade dampened growth in the second quarter as imports rose more strongly than exports. After the yesterday's worse than expected data for industrial production from Germany, today's data are the second set of numbers that did not meet market participants' expectations. Nevertheless, the miss is not big enough to trigger any panic behavior on the financial markets and the positive sentiment will likely to continue in the future giving the euro a sustained boost across the board.
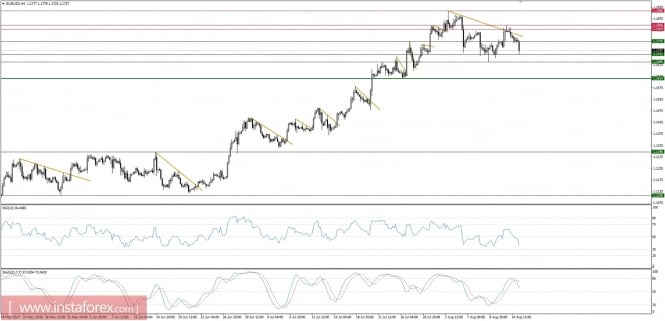
Let's now take a look at the EUR/USD technical picture on the H4 timeframe. After a fake breakout above the golden trend line around the level of 1.1829 and a clear rejection at the level of 1.1846, the price reversed south. Currently, the market is trading just above the local support at the level of 1.1721 and it is still possible the lower levels to be tested as well (1.1686 and even 1.1614). The momentum indicator points to the downside, which supports the bearish bias.

Market Snapshot: Gold at the technical support
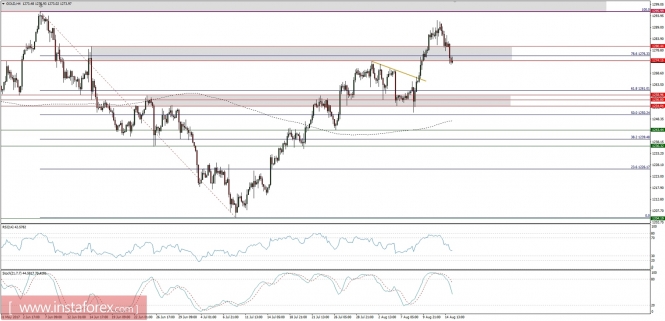
Gold is trading at the technical support at the level of $1,274 after a clear failure to break out above the recent top at the level of $1,296. This technical support is the key level for bulls, any break out lower would indicate a possible further corrective extension towards the level of $1,261.

Market Snapshot: USD/CAD just below the resistance
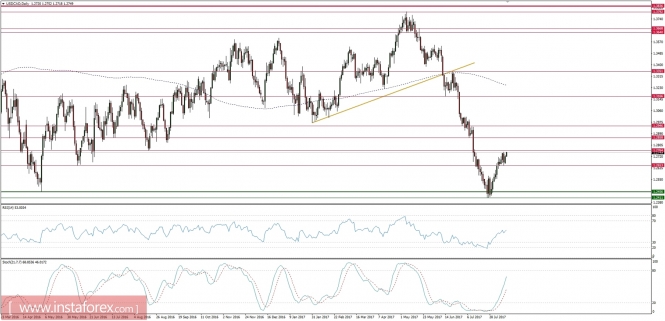
After the bounce from the long-term technical support at the level of 1.2456, the price of USD/CAD broke above the technical resistance at the level of 1.2653 and now is challenging the level of 1.2764. If the breakout will be a success, then the next technical resistance is seen at the level of 1.2858. The momentum indicator looks strong and points to more gains, just as the stochastic oscillator. Short-term bias is to the upside.

