The one who rises high, falls painfully. The growth of Brent prices to a 26-month high against the backdrop of an increase in the net long positions of financial managers to record highs ended- a fiasco of the bulls. The fall from the highs was due to the massive closure of the longs after it became known that Turkey was bluffing, and OPEC members preferred to increase it in September instead of reducing production. Its contribution to the negative was made by the International Energy Agency, which stated that, at current levels of oil production by the cartel, the growth of American production and the active build-up of reserves by China will create problems for reducing global reserves and moving the market to a stable deficit.
So far, only one thing is clear: the higher the prices, the less chance of an extension of the Vienna agreement of OPEC and the greater the likelihood of an active increase in shale production in the United States. IEA predicts that the latest figure in 2018 will grow by an impressive 1.1 million b/d, which is a serious "bearish" driver for Brent and WTI.
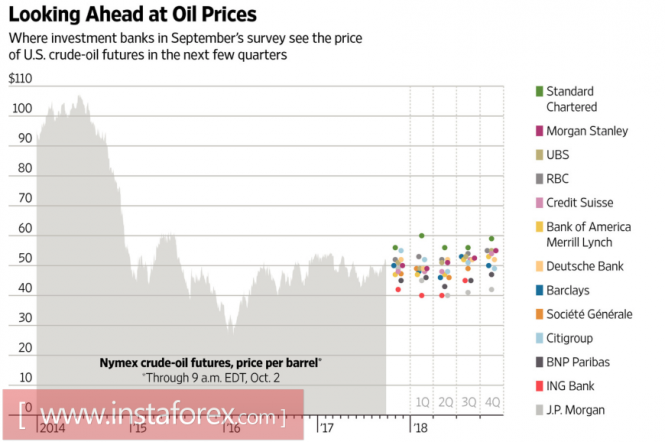
The situation is well understood by large banks. According to the median forecast of 15 of them, the average cost of the Brent in the next year will be $53 per barrel, while the Texas one will be at $50. Oil will not be able to overcome and permanently gain a foothold above the psychologically significant level of $60 even in 2019: forecasts of the average Brent price have been reduced from $72 in September 2016 to $57.91 per barrel.
Projections of oil prices

Source: Wall Street Journal.
In the short-term period, the bearish side plays on the information regarding the growth of production by the OPEC countries, in the medium-term - about the onset of the unfavorable season, as the closure for maintenance of American refineries leads to a reduction in demand and to the growth of US stocks. In addition, the return to the market of the idea of reflationary trade supports the US dollar, which negatively affects the prices of Brent and WTI.
It is not known what games OPEC is playing, but according to a median estimate by Bloomberg experts, in September, the cartel reduced their compliance to their obligations to reduce the production oil from 88% to 80%. The production increased by 120, 000 b/d and amounted to 32.83 million b/d. The index increased: Saudi Arabia by 60, 000 b/d to 10.06 million b/d, Kuwait by 50, 000 b/d to 2.76 million b/d and other countries. It is possible that this was a response to the rise in prices against the backdrop of the referendum on the independence of Kurdistan. OPEC perfectly understands that at a Brent price of $60 per barrel, it will be unrealistic to compete with American producers.
Thus, the strengthening of the dollar, the seasonal factor, the activity of the cartel, the growth of the activity of extractive companies in the United States and the gradual reduction of net oil lagoons create a solid foundation for the reduction of prices of Brent and WTI.
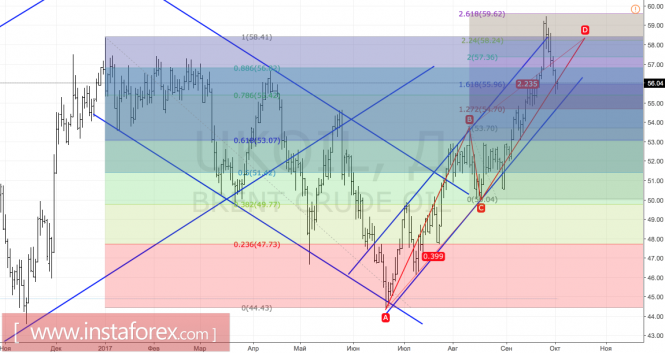
Technically, after implementing a target of 224% on the pattern AB=CD, a natural rollback followed. To develop a correction for "bears", it is necessary to break through the diagonal support in the form of the lower border of the ascending trading channel. On the contrary, the inability of sellers to keep prices below $56 per barrel will be evidence of their weakness.
Brent, daily chart

