EUR/USD: The EUR/USD pair is currently bearish. The EMA 11 is below the EMA 56, and the Williams' % Range period 20 is in the oversold region. The next targets for bears are the support lines at 1.1700, 1.1650, and 1.1600.

USD/CHF: The USD/CHF pair has been going upwards slowly and gradually. Price is now above the support level at 0.9750, going towards the resistance level at 0.9800 (the first target). Then price could go towards other targets at 0.9850 and 0.9000 (resistance levels). As long as EUR/USD goes down, USD/CHF would continue trudging northwards.

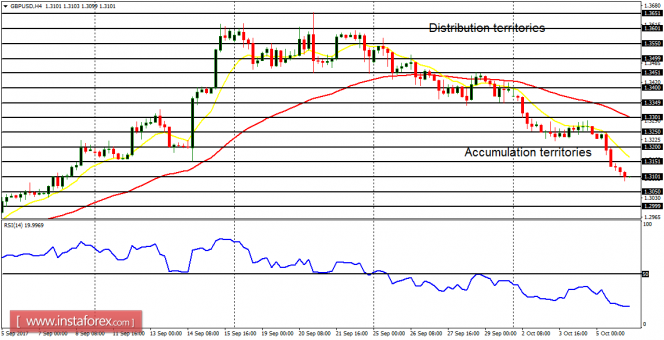
GBP/USD: The GBP/USD pair has dropped by about 260 pips this week (having dropped by 430 pips since last week). There is a huge Bearish Confirmation Pattern in the chart and further downwards movement is possible, which would enable price to reach the accumulation territories at 1.3050, 1.3000, and 1.2950.

USD/JPY: This pair has been moving sideways so far this week, though a closer look at the market shows that bulls still have some advantage. A rise in momentum is expected this week or early next week, which would lead to further upwards movement (in case the Yen is weak). There is also a possibility of a downwards movement (in case the Yen is strong).

EUR/JPY: This cross has generated a short-term "sell" signals. The market has moved below the EMA 11 is the latter moves below the EMA 56. The RSI period 14 is below the level 50, which means price could go lower and lower, reaching the demand zones at 132.00, 131.50, and 131.00. The demand zone at 132.00 has been tested and it would be tested again.

