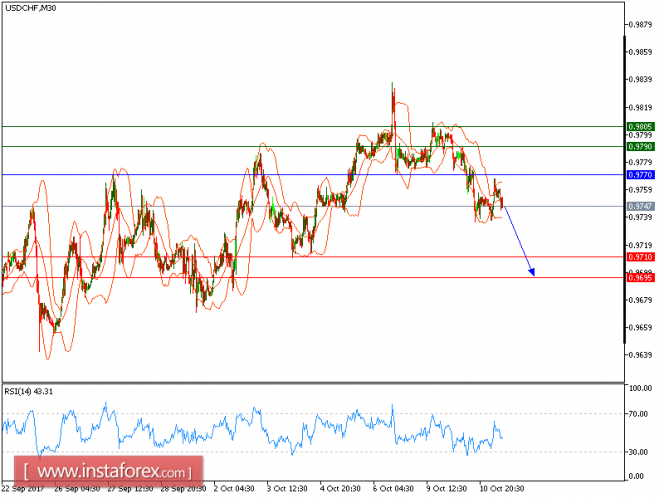
Our both targets which we predicted in yesterday's analysis has been hit. USD/CHF is still under pressure and still expected to move downwards. The pair is capped by a declining trend line since Oct. 9, which confirmed a bearish outlook. The downward momentum is further reinforced by both falling 20-period and 50-period moving averages. The relative strength index is bearish, calling for another downside.
U.S. government bonds showed signs of stabilization following recent declines, with the benchmark 10-year Treasury yield declining to 2.343% from 2.370% in the previous trading session.
The U.S. dollar continued to lose ground to the euro and the British pound which were boosted by upbeat economic data
Hence, below 0.9770, look for a new test with targets at 0.9710 and 0.9695 in extension.
Chart Explanation: The black line shows the pivot point. The present price above the pivot point indicates a bullish position, and the price below the pivot points indicates a short position. The red lines show the support levels and the green line indicates the resistance levels. These levels can be used to enter and exit trades.
Strategy: SELL, Stop Loss: 0.9770, Take Profit: 0.9710
Resistance levels: 0.9790, 0.9805, and 0.9845
Support levels: 0.9710, 0.9695, and 0.9650
The material has been provided by InstaForex Company - www.instaforex.com