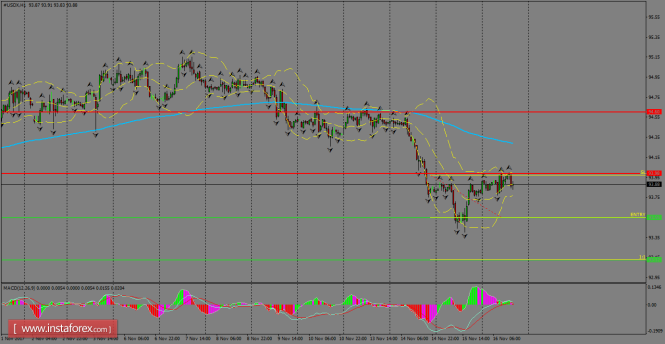
The index is capped by the resistance and psychological level of 94.00 and the efforts to advance are losing steam. The 200 SMA at the H1 chart is providing the path for the short-term and one could expect any sell of the rallies, but if it manages to break above the moving average, then it can go towards the 94.60 level.

H1 chart's resistance levels: 93.98 / 94.60
H1 chart's support levels: 93.55 / 93.12
Trading recommendations for today: Based on the H1 chart, place sell (short) orders only if the USD Index breaks with a bearish candlestick; the support level is at 93.55, take profit is at 93.12 and stop loss is at 93.97.
The material has been provided by InstaForex Company - www.instaforex.com