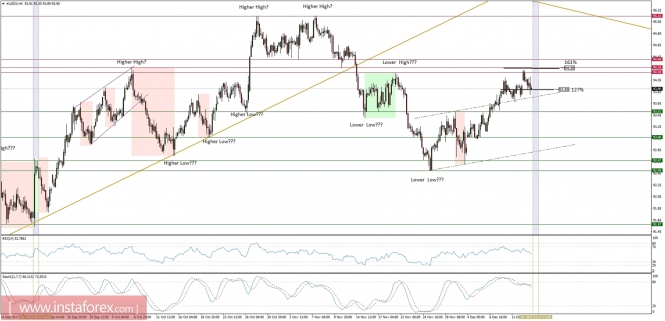
In November, the annual growth of US consumer prices reached a consensual level of 2.2%, which should be treated as a result of a strong rebound in energy prices in the face of cheaper food and fuels for private transport. A slight disappointment was provided by CPI Core prices, which came just below market expectations (1.7% y/y, consensus: 1.8%). The decomposition of price pressure reflects the argument of more hawkish-minded Fed members, which contributes to the appreciable depreciation of the US Dollar.
CPI serves as the headline figure for inflation. Simply put, inflation reflects a decline in the purchasing power of the dollar, where each dollar buys fewer goods and services. In terms of measuring inflation, CPI is the most obvious way to quantify changes in purchasing power. The report tracks changes in the price of a basket of goods and services that a typical American household might purchase. An increase in the Consumer Price Index indicates that it takes more dollars to purchase the same set basket of basic consumer items.
Let's now take a look at the US Dollar Index technical picture at the H4 time frame after the CPI data was posted and before the FOMC interest rate decision. The market moved slightly below the technical support at the level of 93.89 and tested the dashed black trend line. The key resistance remains at the level of 94.18 - 94.40, but for now, the market is not willing to test it or break it yet as the oversold conditions favor the downside for the moment.

