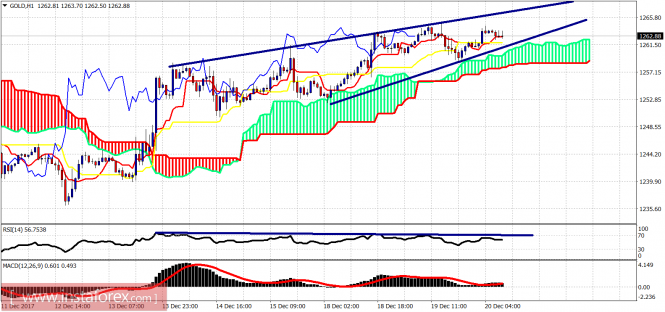
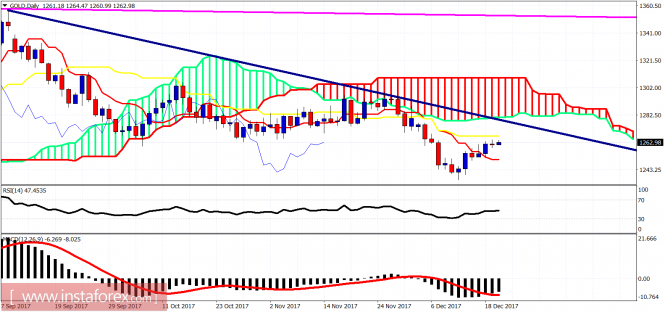
Gold price is still near its highs around $1,265-66. The resistance area above current levels is very important and I continue to expect prices to move lower towards $1,220-$1,230. First weakness sign will be the break below $1,260. Yesterday we saw some signs of weakness but no confirmed reversal yet.

Gold price is giving bearish divergence signs by the RSI while trading above the Ichimoku cloud in the 4 hour chart. Support is at $1,260. I'm bearish at current levels expecting a sharp decline towards $1,240 at least. Resistance is at $1,268.

