The US dollar index has broken out of the bearish Kumo cloud resistance. Trend is changing to bullish as long as price is above 93-92.50. The index has started making higher highs and higher lows on the 4 hour chart.
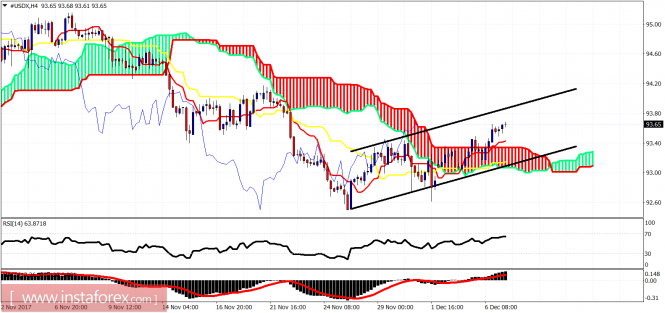
Black lines - bullish channel
The Dollar index is trading above the Ichimoku cloud. Price is inside the bullish short-term channel. Support is found at 93.30 while the resistance lies at 93.80. Trend is bullish.
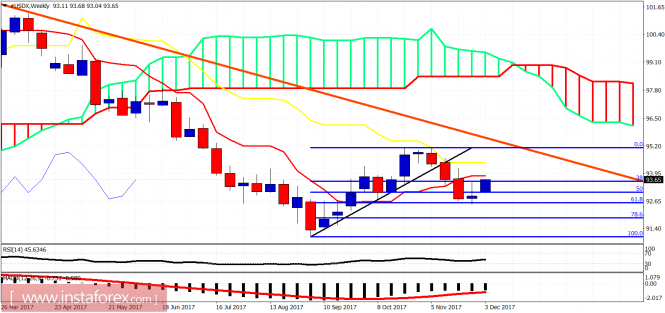
On a weekly basis, the US dollar index has started the bounce exactly as expected. Price is now approaching the Tenkan-sen resistance at 93.80-93.90. A weekly close above this level will be a bullish sign. Next important resistance is at 94.40. Weekly support that must hold now is at 93. A break below 93 will be a very bearish sign for the index.The material has been provided by InstaForex Company -
www.instaforex.com
