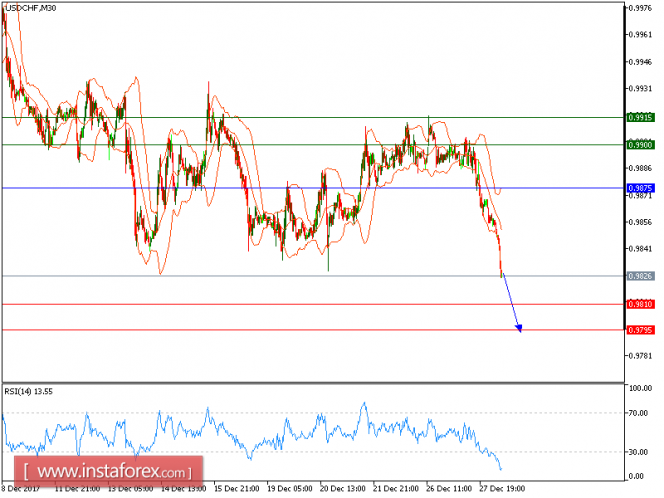
USD/CHF is expected to trade with a bearish outlook. The pair is clearly reversing down, capped by its falling 20-period and 50-period moving averages. The recent bearish breakout of a key horizontal level at 0.9885 should open the downside path toward 0.9810. Last but not least, the relative strength index is badly directed and calls for a new pullback.
To conclude, as long as 0.9875 isn't surpassed, look for further downsides to 0.9810 and 0.9795 in extension.
Chart Explanation: The black line shows the pivot point. The present price above the pivot point indicates a bullish position, and the price below the pivot points indicates a short position. The red lines show the support levels and the green line indicates the resistance levels. These levels can be used to enter and exit trades.
Strategy: SELL, Stop Loss: 0.9875, Take Profit: 0.9810
Resistance levels: 0.9900, 0.9915, and 0.9935
Support levels: 0.9810, 0.9795, and 0.9750
The material has been provided by InstaForex Company - www.instaforex.com