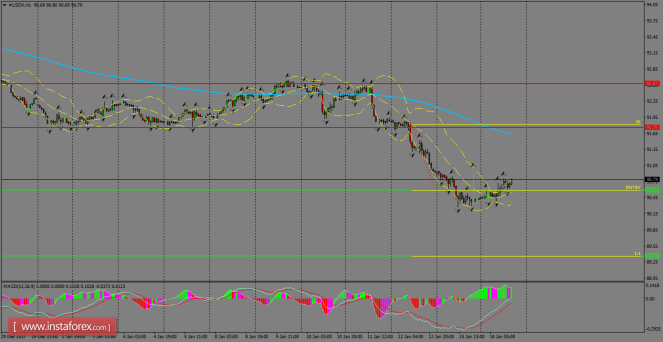
The index is recovering from the recent declines held since January 10th session. The recovery could go towards the 200 SMA around the resistance level of 91.75. That area could act as a dynamic resistance for USDX and the bears could gain momentum for another leg lower towards the support level of 89.36. MACD indicator remains in favor of the bulls.

H1 chart's resistance levels: 91.75 / 92.57
H1 chart's support levels: 90.59 / 89.36
Trading recommendations for today: Based on the H1 chart, place sell (short) orders only if the USD Index breaks with a bearish candlestick; the support level is at 90.59, take profit is at 89.36 and stop loss is at 91.81.
The material has been provided by InstaForex Company - www.instaforex.com