On Tuesday, after the three-day weekend, American investors returned to markets. They did not have much information on which to base the index movement as there was no reaction after the publication of the January NY Empire State Index data, but let us note that the index was 17.7 points while the market participants expected it to remain at 18 points. On the other hand, the SP500 poor performance could be affected by the quarterly result and forecasts of Citigroup and the behavior of General Electric shares (the change in the valuation of the insurance portfolio costs the company over USD 6 billion in profit after tax). Citigroup recorded a huge loss due to the one-off cost resulting from the new tax law, but the results were still better than expected and the shares were slightly more expensive. General Electric shares lost about 4.0%.
Todays data from the US has beat the estimates as well and for a moment, the hope of the US Dollar's return to favor was suggested by data on Industrial Production, which, based on the inflow of soft-data, had a chance to surprise market expectations. December reading at 0.9% m/m (consensus: 0.5% ) is due to great moods in energy companies (5.6%m/m) and automotive (2.0% m/m). The factory production (0.1% m/m, consensus: 0.3%) was just below expectations, due to the appreciable decline in the volume of goods made from metals (-1.5% m/m).
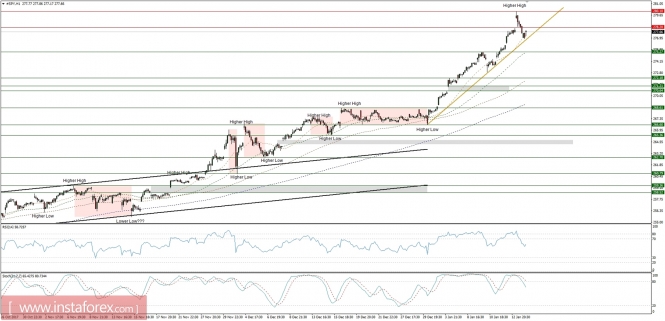
Let's now take a look at the SPY (SP500 EFT) technical picture at the H4 time frame after the data were released. The market made another higher high at the level of 280.10 and the bear took control of it as they managed to push it below the technical support at the level of 278.20. Nevertheless, the price has bounced from the golden trend line support and now is trying to test the resistance at the level of 278.20. The growing bearish divergence is an indication of another leg down to the level of 2175.27.

