
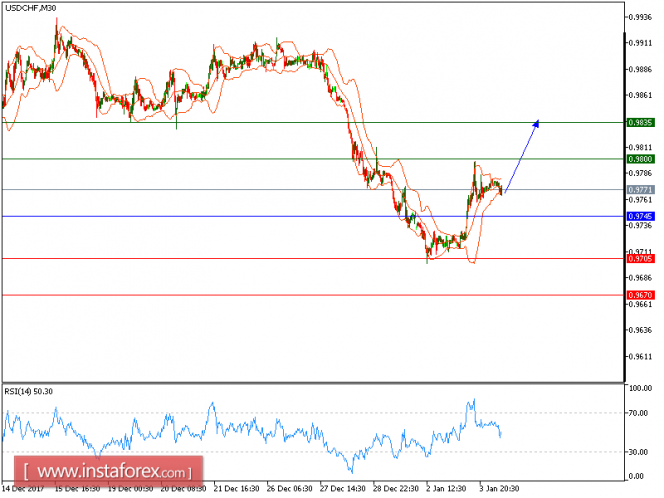
USD/CHF is expected to trade in a higher range as bias remains bullish. The pair has formed a "rounding bottom" pattern, and is now trading above its rising 50-period moving average, which plays a support role. The nearest horizontal level at 0.9745 should limit any downside room, and call for further advance. In addition, the relative strength index is mixed to bearish.
Hence, as long as 0.9745 is not broken, look for further advance to 0.9800 and 0.9835 in extension.
Chart Explanation: The black line shows the pivot point. The present price above the pivot point indicates a bullish position, and the price below the pivot points indicates a short position. The red lines show the support levels and the green line indicates the resistance levels. These levels can be used to enter and exit trades.
Strategy: BUY, Stop Loss: 0.9745, Take Profit: 0.9800
Resistance levels: 0.9800, 0.9835, and 0.9875
Support levels: 0.9705, 0.9670, and 0.9650
The material has been provided by InstaForex Company - www.instaforex.com