It was a hard night for the US Dollar, which loses to all major currencies, and the US Dollar index is the lowest for over three years. The strongest are JPY and CHF. USD/JPY violated 110, EUR/USD trying to break 1.23, GBP/USD approached the 1.4050. The stock market does not show a clear direction, but the trend is still up. The US API report disappointed, but Crude Oil keeps high.
On Wednesday 24th of January, the event calendar is busy with important data releases in form of Flash Manufacturing, Services and Composite PMI from Germany, France, Japan and USA. Moreover, there are Claimant Count Change data releases from the UK as well.
EUR/USD analysis for 24/01/2018:
There is no specific information explaining the US Dollar sell-off, only a return to the trends observed at the turn of the year. Only today's Flash PMI data release might slightly change the trend and provide the base for a pull-back, but they must be exceptionally good. The Eurozone economy is in a very good shape, so it might be possible.
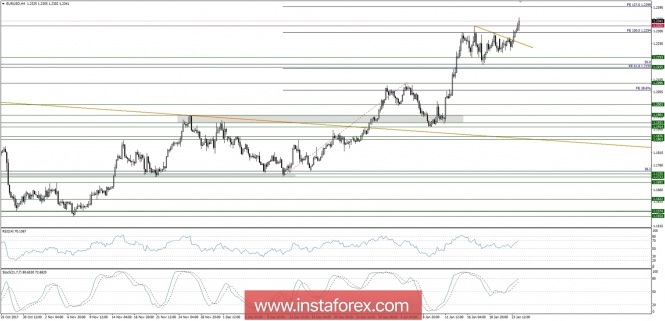
Let's now take a look at the EUR/USD technical picture at the H4 time frame. The price has broken out above the short-term golden trend line resistance and currently is trading around the level of 1.2343 despite the extremely overbought market conditions and growing bearish divergence. The nearest technical support is seen at the level of 1.2321, but the key technical support is seen at the level of 1.2193. The next technical resistance is seen at the level of 1.2400.

Market Snapshot: US Dollar Index goes lower
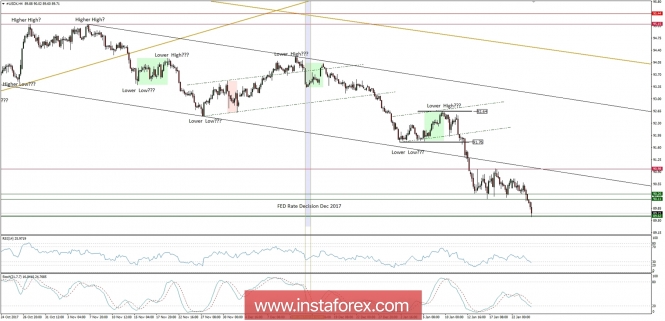
The US Dollar Index fell to the level of 90, the first time since December 2014. US debt market does not help the Dollar when 10-year yields fell to the level of 2.62%. The next technical support is seen at the level of 89.62 and is being tested currently. Please notice the growing bullish divergence.

Market Snapshot: Crude il made Double Top?
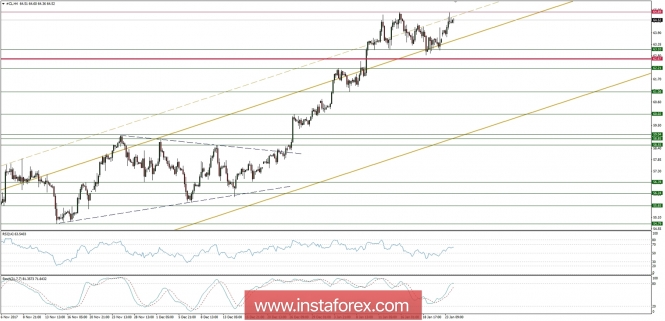
The price of Crude Oil has hit the level of 64.89 again, so now traders can suspect a Double Top pattern in progress, especially if we take into the account the clear bearish divergence between the price and momentum that confirms the negative outlook. The nearest support is seen at the level of 63.10.

