Technical outlook:
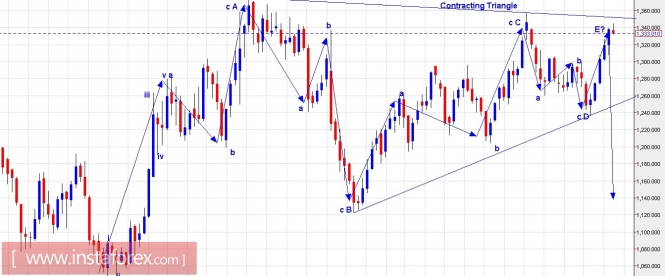
We have presented a weekly chart to represent a multi year consolidation of gold prices. It began in November 2015 with lows at $1,047.00 and has unfolded into 5 waves within a contracting triangle, with each wave sub dividing into 3 waves a-b-c as labelled here. The triangle might be terminating into its last wave E with the recent highs at $1,344/45 levels touched yesterday. For this A-B-C-D-E contracting triangle structure to remain intact, prices should stay below $1,357/58 levels and broadly below $1,375 levels. If the above outlook holds true, we should see prices dropping lower and breaking below $1,236 levels as the first soft target. On the flip side, a break above $1,357 levels would open doors for a test above $1,400/20 levels at least.
Trading plan:
Aggressive traders may want to remain short with stop above $1,357 levels; the target is open.
Silver chart setups:

Technical outlook:
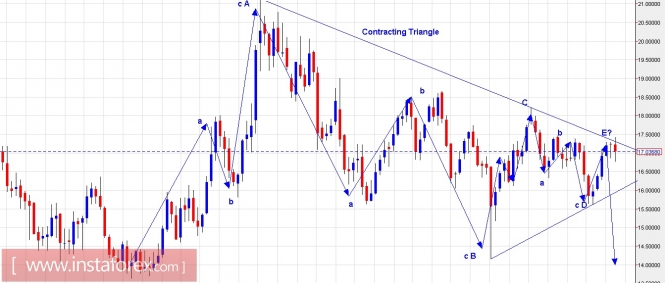
The weekly chart setups for silver also indicate movement similar to a contracting triangle that has been since November 2015. The underlying trend has completed 5 waves as labelled here as A,B,C,D and E, with each wave sub dividing into 3 waves each. Furthermore, wave E has also tested the consolidation line of resistance at $17.40 levels before pulling back. Please note that for this wave count to hold true, prices should stay below $18.21 levels going forward. If this condition remains, we should see silver prices dropping much lower in the weeks to come. The first soft target remains at $15.60 levels though, before pulling back. From the trading point of view, it is good to prepare short positions.
Trading plan:
Aggressive traders would want to remain short with stop above $18.21 levels.
Fundamental outlook:
There are no major fundamental events for the rest of the day.
Good luck!
The material has been provided by InstaForex Company - www.instaforex.com