We are starting a new week on the financial markets, where from the beginning we can see a mixed attitude for the American currency. The US Dollar index is traded today 0.3% lower, which gives us an EURUSD pair around 1.2300. Looking at the macroeconomic calendar, we see a typical Monday with the lack of important readings, in particular for individual economies. Therefore, markets can move according to recent trends and, in particular, respond to technical levels.
EUR/USD analysis for 12/02/2018:
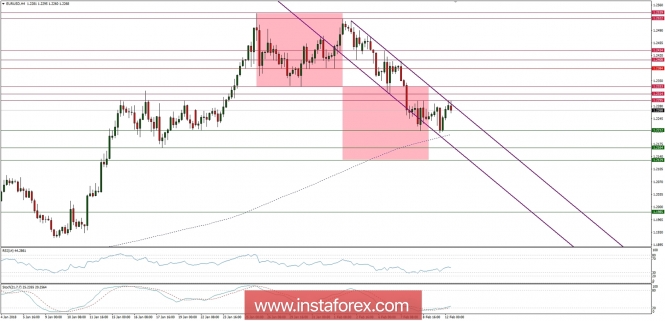
At the weekly time frame of the EURUSD, the market participants can see a potential formation of a shooting star, which could lead to a drop of steam to around 1.2150, which is also the 50% Fibonacci retracement of the downward wave started in mid-2014. As can be seen in the chart below, the pair has strong support in the form of a medium-term upward trend line, so when the market falls into these areas, we can deal with the re-activation of the bulls. On the lower time frame, the price has just failed to break out higher above the technical resistance at the level of 1.2295 and now is reversing down from this level. The next technical support is seen at the level of 1.2212.The momentum is still below its fifty level, so the down move might be abrupt and sudden.

Market Snapshot: SPY bounces from the trendline
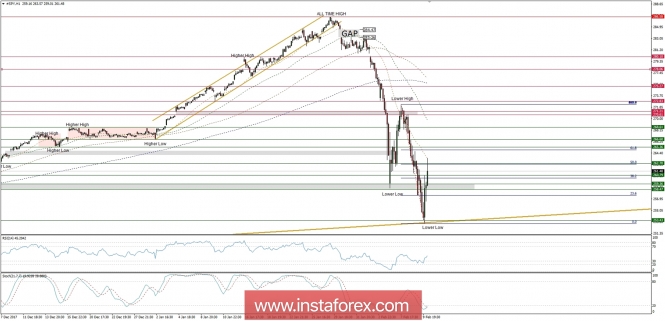
The price of SPY (SP500 ETF) has bounced from the golden trend line at the level of 253.43 and retraced just over 50% of the last leg down. There is a clear bullish divergence formed between the price and the momentum indicator, so it might be the time form another corrective bounce higher. Only a sustained breakout above the level of 272.83 would change the bias from bearish to bullish again.

Market Snapshot: DAX bounces from support
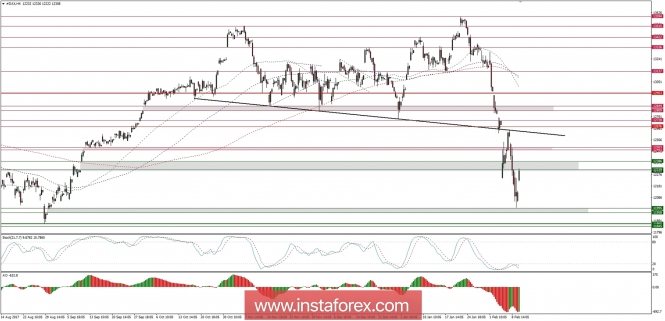
The price of German DAX index has bounced from the technical support at the level of 11,995 and gaped up towards the level of 12,318, which is an important technical resistance level. There is a clear bullish divergence formed between the price and the momentum indicator, so it might be the time form another corrective bounce higher.

