Against the backdrop of worsening relations between the US and Iran, the stubborn and unshakeable conviction that Trump, as a true Republican, will defend the interests of oil companies with all his might and maintain high oil prices, continue to disperse bullish sentiments. But all this fundamentally speculative basis is shaky and temporary.
Just yesterday, the White House said that the United States is ready to invest and develop Iran if it agrees to conclude a new all-encompassing nuclear program, which consists in eliminating all nuclear production technologies, stopping the development of ballistic missiles, withdrawing troops from Syria, etc. Otherwise, Iran will fall under "unprecedented pressure pressure." Iran is thinking over an ultimatum.
Trump's Republican affiliation does not guarantee such a straightforward relationship of the entire US political system to the same factor as the price of oil. The splicing up of republican and democratic monopolies and the largest banks in the past 10 years has pointed very precisely to the rapprochement for political purposes. We wrote about this during the election of President Trump nominations for the post of Fed chairman.
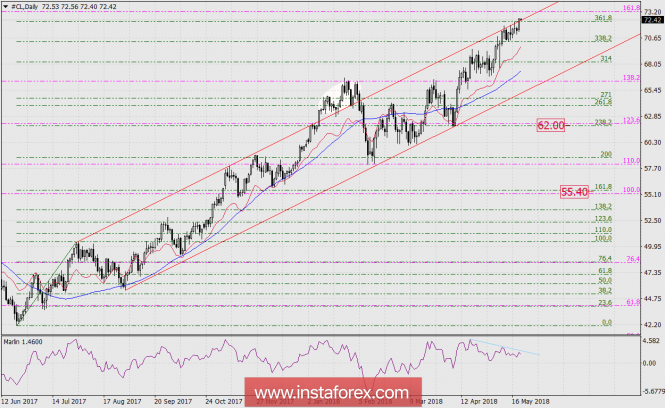
Considering the technical aspect of the outlook development of oil prices. First of all, the striking divergence in the eye of the oscillator Marlin which is not a reversal signal, but a warning. The primary signal of the trend reversal will be the transition of the signal line to the zero line.
To date, the price has punctured the level of the Fibonacci reaction of 361.8%, built on the first section of the trade on June 26, 2017 - August 1, 2017 (green grid). Also, the price has been moving for several days under the upper trend line of the price channel. There may be a false exit of the price from this channel, as it happened in early January this year (white oval), and the price returned to the channel only after a month. But now, the general picture is different and the movement can be stopped by the Fibonacci level 161.8% pink (73.25), built from the first growth line in February 2016 (min 26.05) - January 2017, which will bring the price back to the channel quite quickly.
Thus, we are expecting the oil price to turn from its current levels with the prospect of moving to 62.00, where the two levels of the different Fibonacci grids are the same: 238.2% and 123.6%.
In the long term, a deeper decline to 55.40 is also possible to happen in its own time.

* The presented market analysis is informative and does not constitute a guide to the transaction.
The material has been provided by InstaForex Company - www.instaforex.com