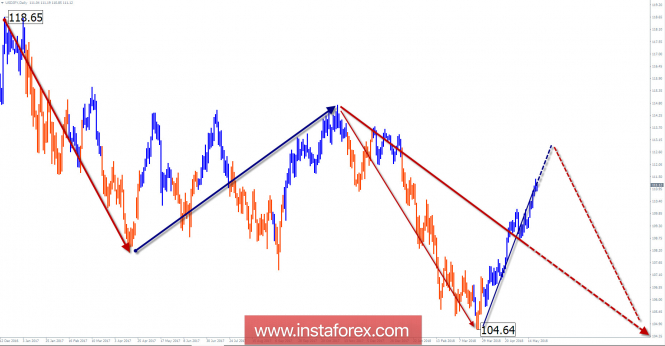
Wave picture of the chart D1:
The direction of the trend since December 2016 forms a bearish wave. The wave proportions have reached the minimum permissible level of elongation, but no completion signals have been observed so far.

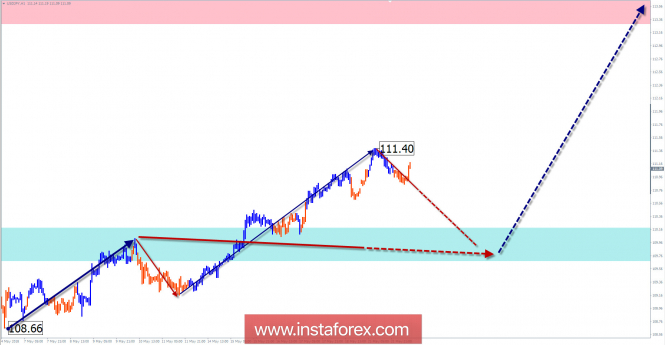
The wave pattern of the graph H1:
From the middle of February, the vector of price movement was replaced by an upward trend. Given the type of structure and the wave level of motion, the current wave in a larger model will take the place of correction.

The wave pattern of the M15 chart:
Within the trend wave in recent weeks there has been a hidden bearish correction. It lacks the final part.
Recommended trading strategy:
Trading large periods of the schedule while it is better to refrain from transactions. Short-term employees have a good reason to make purchases at the end of the coming rollback.
Resistance zones:
- 113.30 / 113.80
Support zones:
- 110.20 / 109.70
Explanations to the figures: Simplified wave analysis uses a simple waveform, in the form of a 3-part zigzag (ABC). At each TF the last incomplete wave is analyzed. Zones show the calculated areas with the greatest probability of a turn.
Arrows indicate the wave counting according to the technique used by the author. The solid background shows the generated structure, dotted - the expected wave motion.
Attention: The wave algorithm does not take into account the duration of the tool movements in time. To conduct a trade transaction, you need confirmation signals from your trading systems!
The material has been provided by InstaForex Company - www.instaforex.com