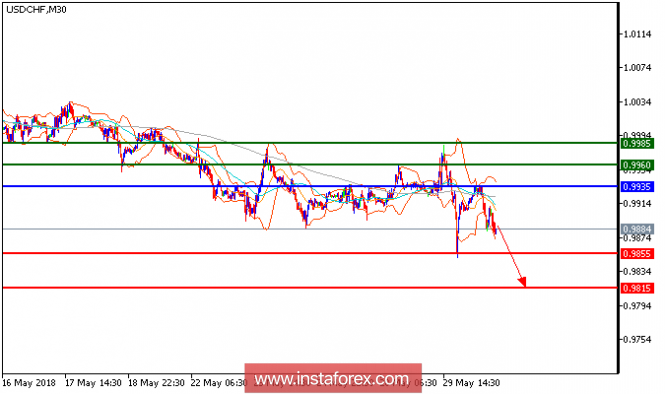
USD/CHF is expected to trade with a bearish outlook. The key resistance at 0.9935. Despite yesterday's technical rebound, the pair is still under pressure below its horizontal resistance at 0.9930. A bearish cross has been identified between the 20-period and 50-period moving averages. Additionally, the relative strength index lacks upward momentum. Even though a continuation of the technical rebound cannot be ruled out, its extent should be very limited. Below 0.9930, look for a new decline to 0.9855 and 0.9815 in extension. .
Fundamentals:
After a strong end to 2017 and apparently a good start to this year, the Swiss economy appears to be softening. The KOF Economic Barometer fell 3.3 points in May to 100, right at its long-term average. The May reading was the weakest since the end of 2015.
Chart Explanation: The black line shows the pivot point. The present price above the pivot point indicates a bullish position, and the price below the pivot point indicates a short position. The red lines show the support levels, and the green line indicates the resistance levels. These levels can be used to enter and exit trades.
Strategy: SELL, stop loss at 0.9955, take profit at 0.9855.
Resistance levels: 0.9960, 0.9980, and 1.0005
Support levels: 0.9855, 0.9815, and 0.9775
The material has been provided by InstaForex Company - www.instaforex.com