Technical outlook:
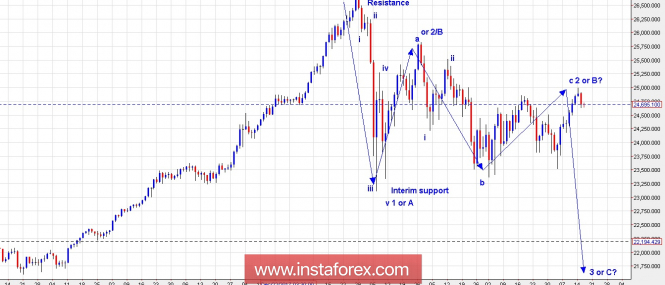
A daily chart view has been presented here to have a bigger picture. The Dow Jones index looks to be consolidating at the moment broadly between 23,300 and 25,000 levels and is most likely expected to break below 23,000 levels eventually. Dow has hit resistance at 25,000 levels day before yesterday and reversed sharply lower since then. Please also note that the indice has produced an evening star bearish pattern as well indicating that another meaningful lower top might have already formed. Looking into the wave count, the first drop from sub 26,700 through 23,000 levels is a clear impulse (5 waves) hence it has been labelled as wave 1 or A. The subsequent rally through 25750 levels can be labelled as wave 2 or B or wave a within a more complex wave 2 or B. In both scenarios, the Dow Jones looks to be ready to be unfolding into wave 3 or C as labelled expectation. Selling on rallies is preferred trading strategy for now.
Trading plan:
Remain short for now, stop above 25,750, target 20,000/21,000
Fundamental outlook:
Watch out for ECB president Draghi's speech in Frankfurt at 08:00 AM EST.
Good luck!
The material has been provided by InstaForex Company - www.instaforex.com