Technical outlook:
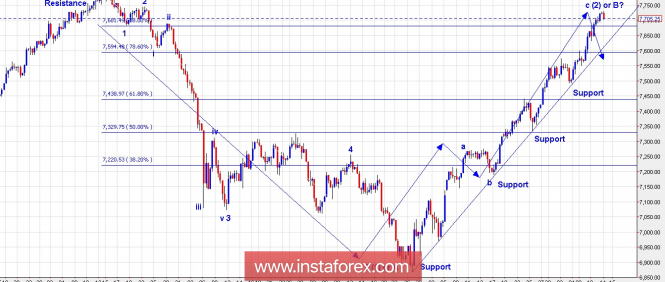
We have presented a 4H chart view for FTSE to have a medium-term outlook, after having discussed last on April 30, 2018. The price action suggests that FTSE might have topped out at 7790/95 levels in January 2018. Thereafter, the indice has dropped lower unfolding into 5 waves (impulse) as labelled here as wave (1) or A. Subsequently the steep rally has went past the fibonacci 88% as shown here. A typical wave (2) property would be it can retrace wave (1) to these levels. Bottom line, till prices stay below 7790/95, the high made in January 2018, FTSE is expected to remain in control of bears going forward. A break below the 7650 levels would also break the steep rising support trend line and accelerate lower. Price support comes in at 7500 levels, followed by 7300 and lower. If the above wave structure holds good, we should see FTSE dropping below 6900 levels going forward.
Trading plan:
Remain short with risk above 7795 levels, targeting below 6900 levels.
Fundamental outlook:
There are no major events lined up for the day.
Good luck!
The material has been provided by InstaForex Company - www.instaforex.com