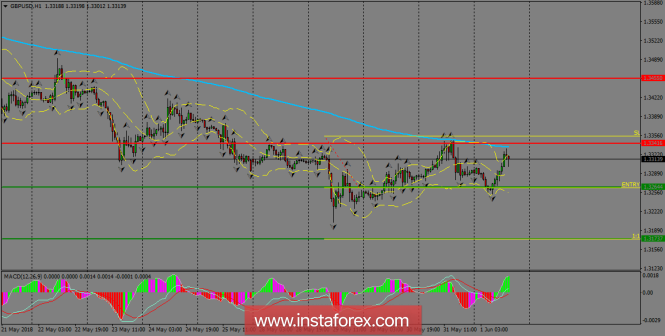
The pair is looking for a clear direction across the board, as the bulls are making a shy attempt to regain the control of the situation. The 200 SMA at H1 chart keeps adding pressure to the downside as a dynamic resistance, but if GBP/USD manages to break above 1.3341, then we can expect further rallies toward the 1.3455 level.

H1 chart's resistance levels: 1.3341 / 1.3455
H1 chart's support levels: 1.3264 / 1.3173
Trading recommendations for today: Based on the H1 chart, sell (short) orders only if the GBP/USD pair breaks a bullish candlestick; the resistance level is at 1.3264, take profit is at 1.3173 and stop loss is at 1.3354.The material has been provided by InstaForex Company - www.instaforex.com