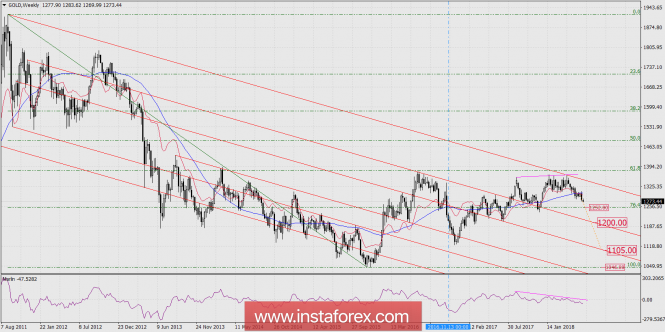
Based on title of the review, it can be assume that the answer may be negative. Indeed, the technical picture precisely shows the negative scenario of the medium-term development of this instrument. Considering the schedule for the weekly scale:

The price in the Marlin oscillator formed an eight-month divergence. The indicator signal line decreases in the negative zone at a moderate rate, which is a sign of stability and long-term trend. The price was fixed under the balance line of the price (red) and the blue moving average line - the signal of the formed trend.
In this case, the Fibonacci level of 76.4% is valid, it was able to hold the price from the summer of 2013, accordingly. The price of 1252 is considered as the first target and strong support but this externally strong level has an inner weakness. In the event that the penetration of the level occurred when the price was under the blue moving average line, the price went deep down (November 2016).
In this regard, we are waiting for overcoming the support of 1252 and a decrease to the trend line of the price channel 1200, which is the first goal. Then the second goal 1105 opens, after which the November 2015 attack may hit 1046.00.
The examined situation has two positive aspects: there will be more favorable prices for long-term investments in gold (bullions, coins, OMC, mutual funds, etc.), and the world crisis may not begin before the year ends.
* The presented market analysis is informative and does not constitute a guide to the transaction.
The material has been provided by InstaForex Company - www.instaforex.com