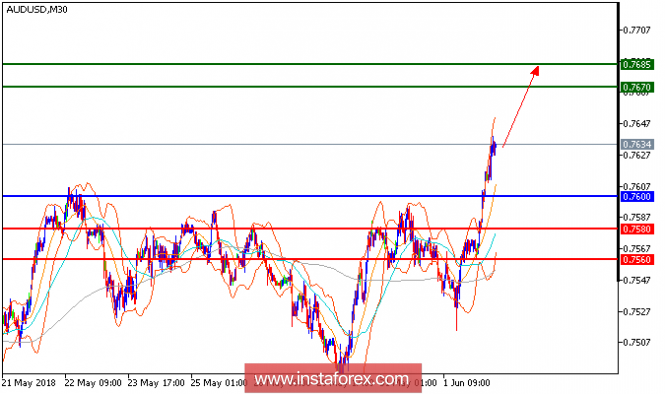
AUD/USD is expected to trade with bullish outlook. The pair broke above the declining trend line since May 31, which confirmed a bullish outlook. The 20-day moving average turned up and crossed above the 50-day one. The relative strength index is mixed to bullish. Therefore, as long as 0.7600 holds on the downside, look for a rebound to 0.7670. A break above this level would trigger another rise to 0.7685.
Fundamental Overview: Eearlier today, the Australian retail sales increased by 0.4% against the forecast of 0.3%. Previously it was atv 0.0%. The data pushed AUD/USD higher. As for other news, the Australian job ads rose 1.5% last month, more than reversing the cumulative 0.7% drop from February-April. Year-over-year, growth accelerated to 11.5% in May from April's 8.7%. ANZ calls it quite encouraging to see job ads' May performance, coming at a time that other forward indicators of the labor market remain positive.
Chart Explanation: The black line shows the pivot point. Currently, the price is above the pivot point which is a signal for long positions. If it remains below the pivot point, it will indicate short positions. The red lines show the support levels, while the green line indicates the resistance levels. These levels can be used to enter and exit trades.
Resistance levels: 0.7670, 0.7685, and 0.7715
Support levels: 0.7580, 0.7560, and 0.7525
The material has been provided by InstaForex Company - www.instaforex.com