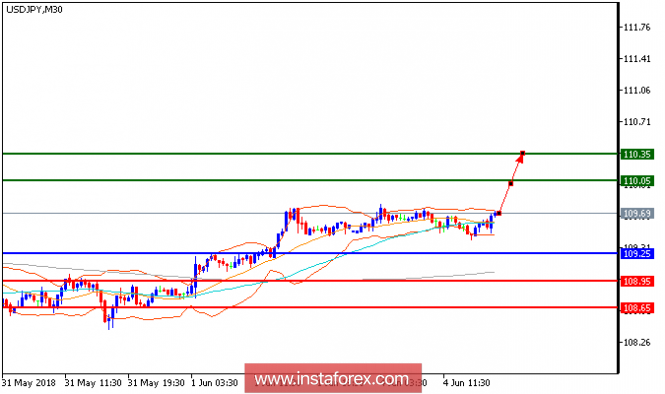
USD/JPY is expected to trade in a higher range. The pair managed to break above its previous declining trend line, which should confirm a bullish reversal. Both the 20-period and 50-period moving averages are turning up now, calling for a new rise. Besides, the relative strength index stands firmly above its neutrality area at 50. Therefore, as long as 109.25 is support, look for a new bounce to 110.05 and 110.35 in extension.
Fundamental Overview: As far as today's data is concerned Orders for U.S. manufactured goods decreased 0.8% to a seasonally adjusted $494.4 billion in April, the Commerce Department said today. The April 0.8% decrease is below economists' expectations of a 0.5% drop.April's fall was driven in part by a drop in orders for durable or long-lasting,goods and transportation equipment. Also The New York chapter of the Institute for Supply Management said its current business conditions index fell to 56.4 in May from 64.3 in April.
Chart Explanation: The black line shows the pivot point. Currently, the price is above the pivot point which is a signal for long positions. If it remains below the pivot point, it will indicate short positions. The red lines show the support levels, while the green line indicates the resistance levels. These levels can be used to enter and exit trades.
Resistance levels: 110.05, 110.35, 110.70
Support levels: 109.25, 108.95, 108.65
The material has been provided by InstaForex Company - www.instaforex.com