4h

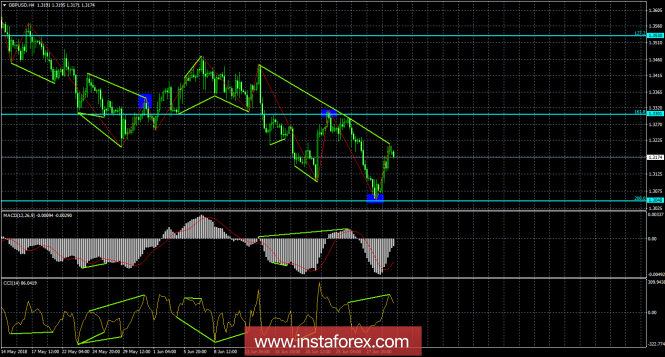
The GBP/USD pair on the 4-hour chart reversed in favor of the US dollar and began the process of falling towards the Fibo level of 200.0% - 1.3048, after the formation of a bearish divergence at the CCI indicator. Passing the last peak of the divergence will allow to expect the resumption of growth towards the corrective level of 161.8% - 1.3301. Fixing the pair above the Fibo level 161.8% will increase the probability of further growth in the direction of the next correction level of 127.2% - 1.3530.
The Fibo grid is built on extremes from March 1, 2018 and April 17, 2018.
1h

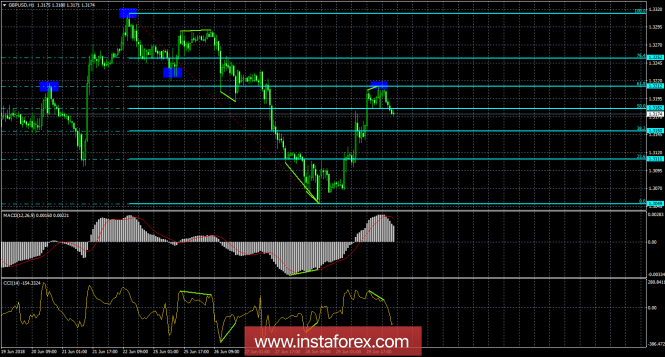
On the hourly chart, the GBP/USD pair reversed in favor of the US currency, after rebounding from a correction level of 61.8% to 1.3212 and a bearish divergence in the CCI indicator. As a result, the quotes were consolidated under the Fibo level at 50.0% - 1.3182, and the decline could be continued in the direction of the following correction levels 38.2% - 1.3150 and 23.6% - 1.3111. There are no new brewing divergences in any indicator. The release of quotations from the Fibo level of 38.2% will allow to expect some growth.
The Fibo grid is built on the extremes of June 22, 2018 and June 28, 2018.
Recommendations for traders:
Buying of the GBP/USD pair can be opened with targets of 1.3182 and 1.3212 and the Stop Loss order under the correction level of 1.3150 if there is a retreat from the Fibo level of 38.2% (hourly chart).
Selling the GBP/USD pair is now possible with targets of 1.3150 and 1.3111 and a Stop Loss order above the correction level of 50.0%, as there was a retreat from the Fibo level of 61.8% from the bearish divergence, and a bearish divergence was formed on the 4-hour chart.
The material has been provided by InstaForex Company - www.instaforex.com