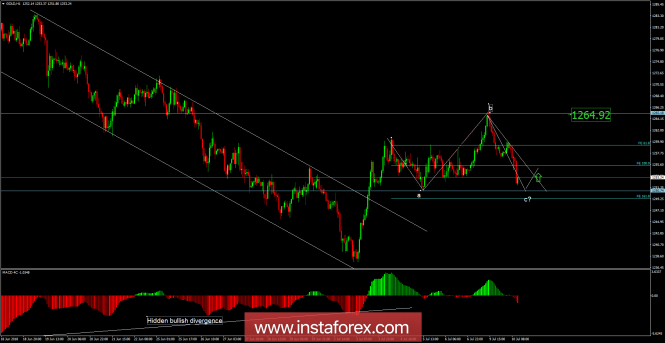
Recently, Gold has been trading downwards. The price tested the level of $1,253.00. According to the H1 time - frame, I found a potential completion of downward correction (abc flat), which is a sign that selling at this stage looks risky. I also found a hidden bullish divergence in the background, which is another sign of strength. My advice is to watch for a potential breakout of the supply trendline to confirm a further upward direction. The upward target is set at the price of $1,264.90.
Resistance levels: R1: $1,265.20R2: $1,271.50R3: $1,275.40
Support levels: S1: $1,254.60S2: $1,250.20S3: $1,244.40
Trading recommendations for today: watch for potential buying opportunities.
The material has been provided by InstaForex Company - www.instaforex.com