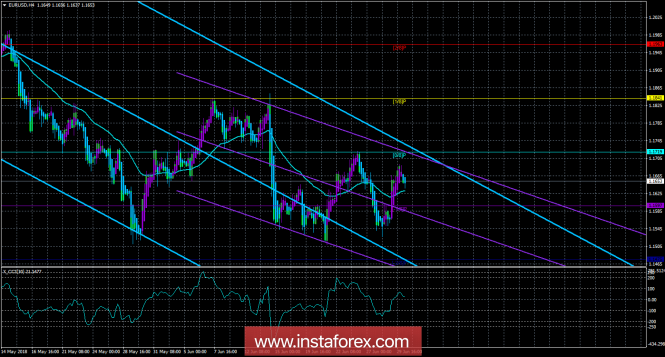
4-hour timeframe

Technical data:
The senior channel of linear regression: direction - down.
The younger channel of linear regression: direction - down.
The moving average (20; flattened) is up.
СCI: 21.1472
On June 29, the currency pair EUR / USD made a breakthrough and overcame the moving middle line. Nevertheless, the trend remains descending, and we state the fact that the pair correction has become deeper. This means that the advantage of the US dollar is gradually beginning to dry up, traders do not find good reasons for opening new and large shorts. And it is not surprising, because now it is completely unclear how to end the whole epic with trade wars between the States and partners. On Monday, July 2, we should pay attention to the indices of business activity in the manufacturing sector of the EU Markit and the similar ISM index of the USA. Also today, the unemployment rate in Europe for May will be published. The forecasts for these reports are neutral, but any negative information from the EU can bring traders back to dollar purchases, most likely short-term. Both channels of linear regression are still directed downwards, which indicates that the downward trend in the medium and long-term plans for the instrument remains in place.
Nearest support levels:
S1 - 1.1597
S2 - 1.1475
Nearest resistance levels:
R1 = 1.1719
R2 - 1.1841
R3 = 1.1963
Trading recommendations:
Currency pair EUR / USD has overcome the moving, but it can not develop the movement. The color of 1-2 bars in the purple color will serve as a signal for the opening of new buy-positions with the target of 1,1719. Meanwhile, a downward correction has begun and continued.
Orders for sale can be reopened if traders are fixed below the moving average line and, preferably, at 1.1597 with a target of 1.1475. In this case, the formation of a downtrend is likely to resume.
In addition to the technical picture, one should also take into account the fundamental data and the time of their release.
Explanations for illustrations:
The upper channel of linear regression is the blue lines of unidirectional motion.
The lowest linear regression channel is the violet lines of unidirectional motion.
CCI - the blue line in the indicator window.
Moving average (20; smoothed) - the blue line on the price chart.
Levels of Murray - multi-colored horizontal stripes.
Heiken Ashi is an indicator that color bars in blue or purple.
The material has been provided by InstaForex Company - www.instaforex.com