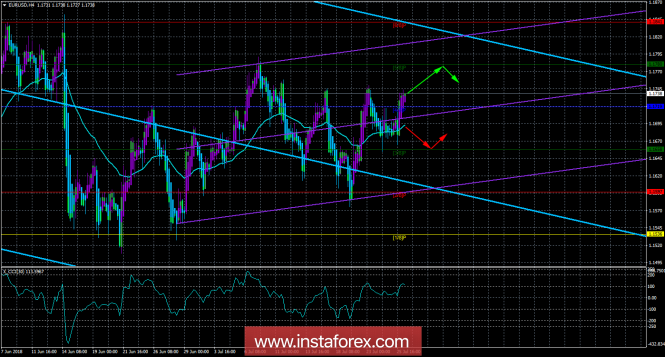
4-hour timeframe

Technical data:
Senior channel of linear regression: direction - down.
The younger channel of linear regression: the direction is up.
Moving average (20; flattened) - sideways.
СCI: 113.5967
The EUR / USD currency pair showed an upward movement on July 25. The main growth of the currency pair fell in the second half of the day. , as it was at this time that it became known that the European Commission President Jean-Claude Juncker and the US leader Donald Trump agreed to gradually reduce the customs pressure and step-by-step to cancel trade duties. First of all, this is the good of the EU and the euro, since it was the EU economy that would have been hit harder by the trade war. If the duties are really reduced to their complete cancellation, this will be good for both the US economy and the EU economy. At the same time, we draw attention to the fact that around. Therefore, from a technical point of view, it is very likely that a third downturn and return to the moving middle line. Moreover, the results of the ECB meeting will be announced today and Mario Draghi could be disappointed the markets. If his rhetoric today is "soft" and cautious, it can put pressure on the euro and force traders to return to euro sales.
Nearest support levels:
S1 = 1.1719
S2 = 1.1658
S3 - 1.1597
Nearest resistance levels:
R1 = 1.1780
R2 - 1.1841
R3 = 1.1902
Trading recommendations:
The EUR / USD currency pair rebounded from the moving average and started a new round of upward movement. Both of yesterday's goals have already been worked out. If the bulls manage to push the level of 1.1745, the target for the new long positions will be Murray's level of "5/8" at 1.1780.
It is recommended to open a sell order in case the price is fixed below the moving average. In this case, the initiative for the instrument will again be taken over by bears for a while, and the target for the downward movement will be the level of 1.1658.
In addition to the technical picture, one should also take into account the fundamental data and the time of their release.
Explanations for illustrations:
The upper channel of linear regression is the blue lines of unidirectional motion.
The lowest linear regression channel is the violet lines of unidirectional motion.
CCI - the blue line in the indicator window.
Moving average (20; smoothed) - the blue line on the price chart.
Levels of Murray - multi-colored horizontal stripes.
Heiken Ashi is an indicator that color bars in blue or purple.The material has been provided by InstaForex Company - www.instaforex.com