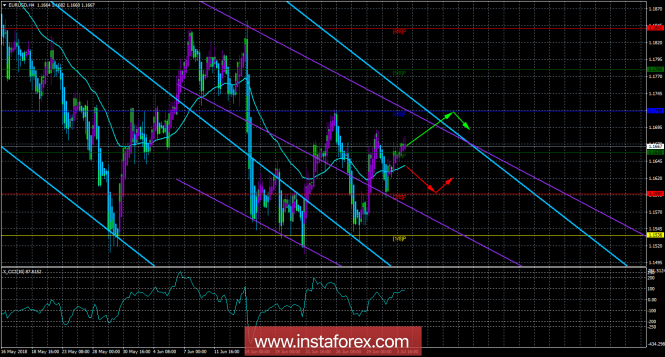
4-hour timeframe

Technical data:
The senior channel of linear regression: direction - down.
The younger channel of linear regression: direction - down.
Moving average (20; flattened) - sideways.
СCI: 87.6152
The currency pair EUR / USD on July 3 tried to continue the upward movement and even surpassed the level of Murray "3/8", but now the advantage of bulls looks extremely weak. This is clearly seen in the declining extremes of prices, each of which is lower than the previous one. Today in America is a day off to celebrate Independence Day. Thus, volatility for all instruments in which there is a US dollar can significantly decrease. Nevertheless, we do not have a signal at the moment for the beginning of the downward correction, thus, we can keep the open lines. In Europe today will be published indexes of business activity in the fields of services and production Markit. However, they are unlikely to have a strong impact on traders. Thus, there will be few fundamental factors on the market today.
Nearest support levels:
S1 = 1.1658
S2 - 1,1597
S3 - 1.1536
Nearest resistance levels:
R1 = 1.1719
R2 = 1,1780
R3 = 1.1841
Trading recommendations:
The currency pair EUR / USD continues to be located above the removals. Thus, long positions now remain relevant for the purpose of 1,1719. Turning the indicator of Heikin Ashi down will indicate the beginning of a very likely downward correction.
It is recommended to open a sell order after the bear has crossed the moving average line with a target of 1.1597. In this case, the descending trend may resume, especially as it continues to be supported by two linear regression channels.
In addition to the technical picture, one should also take into account the fundamental data and the time of their release.
Explanations for illustrations:
The upper channel of linear regression is the blue lines of unidirectional motion.
The lowest linear regression channel is the violet lines of unidirectional motion.
CCI - the blue line in the indicator window.
Moving average (20; smoothed) - the blue line on the price chart.
Levels of Murray - multi-colored horizontal stripes.
Heikin Ashi is an indicator that color bars in blue or purple.
The material has been provided by InstaForex Company - www.instaforex.com