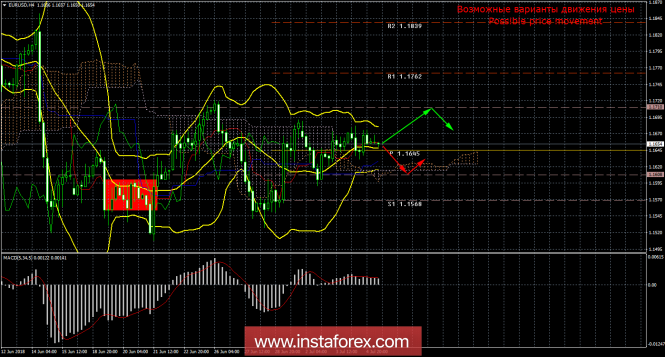
4-hour timeframe

Amplitude of the last 5 days (high-low): 74p - 133p - 98p - 52p - 51p.
The average amplitude for the last 5 days is 82n (98p).
In America, yesterday was a national holiday Independence Day, which for Americans, of course, is the most important. Thus, all financial institutions were closed, and American traders did not enter the market. The minimum volatility was quite expected. Currency pair on this day could not show a unidirectional movement, and from the macroeconomic reports of the last trading day, you can identify the index of business activity in the service and production in the euro area. Both indicators were higher than forecast and previous values. However, due to the secondary character of these reports, no tangible reaction to them ensued. The Bollinger bands very eloquently show that the pair has moved to a lateral movement, as in the past two days volatility is about 50 points a day. As for the prospects for the currency pair, now the market needs any new data. Not even macroeconomic reports, namely, new developments in the trade conflict between the US and EU with China, since it is the topic of trade wars that remains the most discussed. Also, many are interested in the minutes of the last meeting of the Fed, which will be published tonight. However, from past experience, we can say that it is unlikely to be followed by a reaction. Usually, the Fed's protocols do not add any new information after the announcement of the results of the meeting but only summarize it. Thus, the protocol is an interesting event, but no more. Meanwhile, a day off in the US did not stop Trump from starting to clash this time with OPEC. The US leader called on OPEC to reduce gasoline prices, hinting that the US protects many members of the organization for very little money. At the same time, Iran threatens to block any oil supplies through the Strait of Hormuz, if the United States prohibits them from entering the world oil markets. In general, the key figure in the world now remains the odious president of the United States, who can not spend a day without a conflict with any country or organization.
Trading recommendations:
For the pair EUR / USD, it is recommended to consider new long positions, as the "gold cross" continues to be processed with the target of 1.1710. Turning the MACD indicator upward will be a signal for opening the buy-positions.
It is recommended to open sell orders not earlier than securing the pair below the critical line, and ideally, below the Ichimoku cloud. Only, in this case, it will be possible to count on the resumption of the downward trend.
In addition to the technical picture, one should also take into account the fundamental data and the time of their release.
Explanations to the illustration:
Ichimoku Indicator:
Tenkan-sen is a red line.
Kijun-sen is a blue line.
Senkou Span A is a light brown dotted line.
Senkou Span B - a light purple dotted line.
Chinkou Span is a green line.
Bollinger Bands Indicator:
3 yellow lines.
MACD indicator:
Red line and histogram with white bars in the indicator window.
The material has been provided by InstaForex Company - www.instaforex.com